What happens if a voltage dip occurred, and for some reason(s), you had not set the PQ analyzer to capture it or that the PQ analyzer had ran out of memory for capturing of events? (Note: some brands of PQ analyzer do have a limitation on how much event(s) it can record).
The short answer is that you will not be able to get detailed waveforms (and trend) of that particular event. Hence, information such as how long was the dip would not be known.
But not to worry. Not all is lost. You will still be able to get the lowest (minimum) RMS voltage(s) recorded. Depending on the brand/model/software used, one will need to plot out the ‘per-cycle’ RMS voltage minimum trends.
Dranetz, for instance has incorporated these per-cycle trends automatically in their voltage/current trends. So the minimum/maximum value(s) that one see on a Drantez voltage/current RMS trend is really the lowest and highest value(s) recorded.
For others, you need to find things like “Detailed RMS trends”. Typically they termed this as the Vrms 1/2 trends, as seen here.
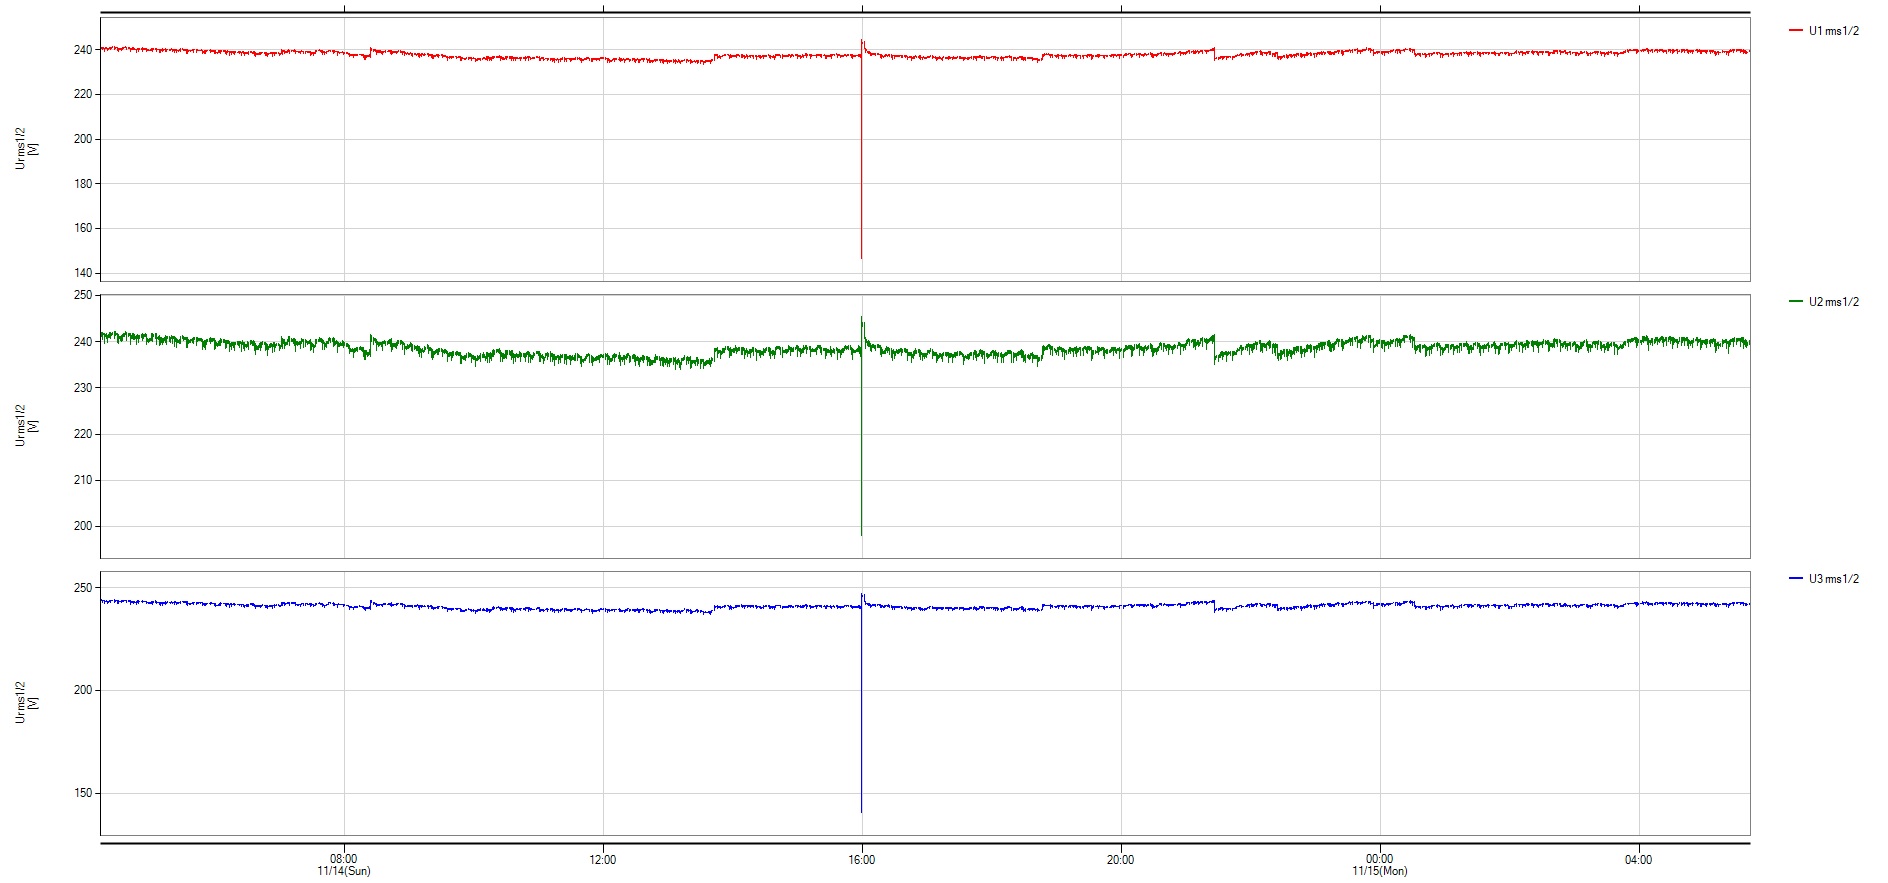
Vrms 1/2 Trend – Showing The Voltage Dip That Occurred on 14/11/2021 1600hrs (V1: 146V, V2: 198V, V3: 140V)
One must be careful not to plot the ‘normal’ RMS trends, which calculate out the RMS values based on sets of 10-cycle waveforms, as shown below. Values here will not show the true worst-case min/max values. Short events like a voltage dip which lasts 3-4 cycles, will get ‘diluted out’ here in a 10-cycle RMS calculation.
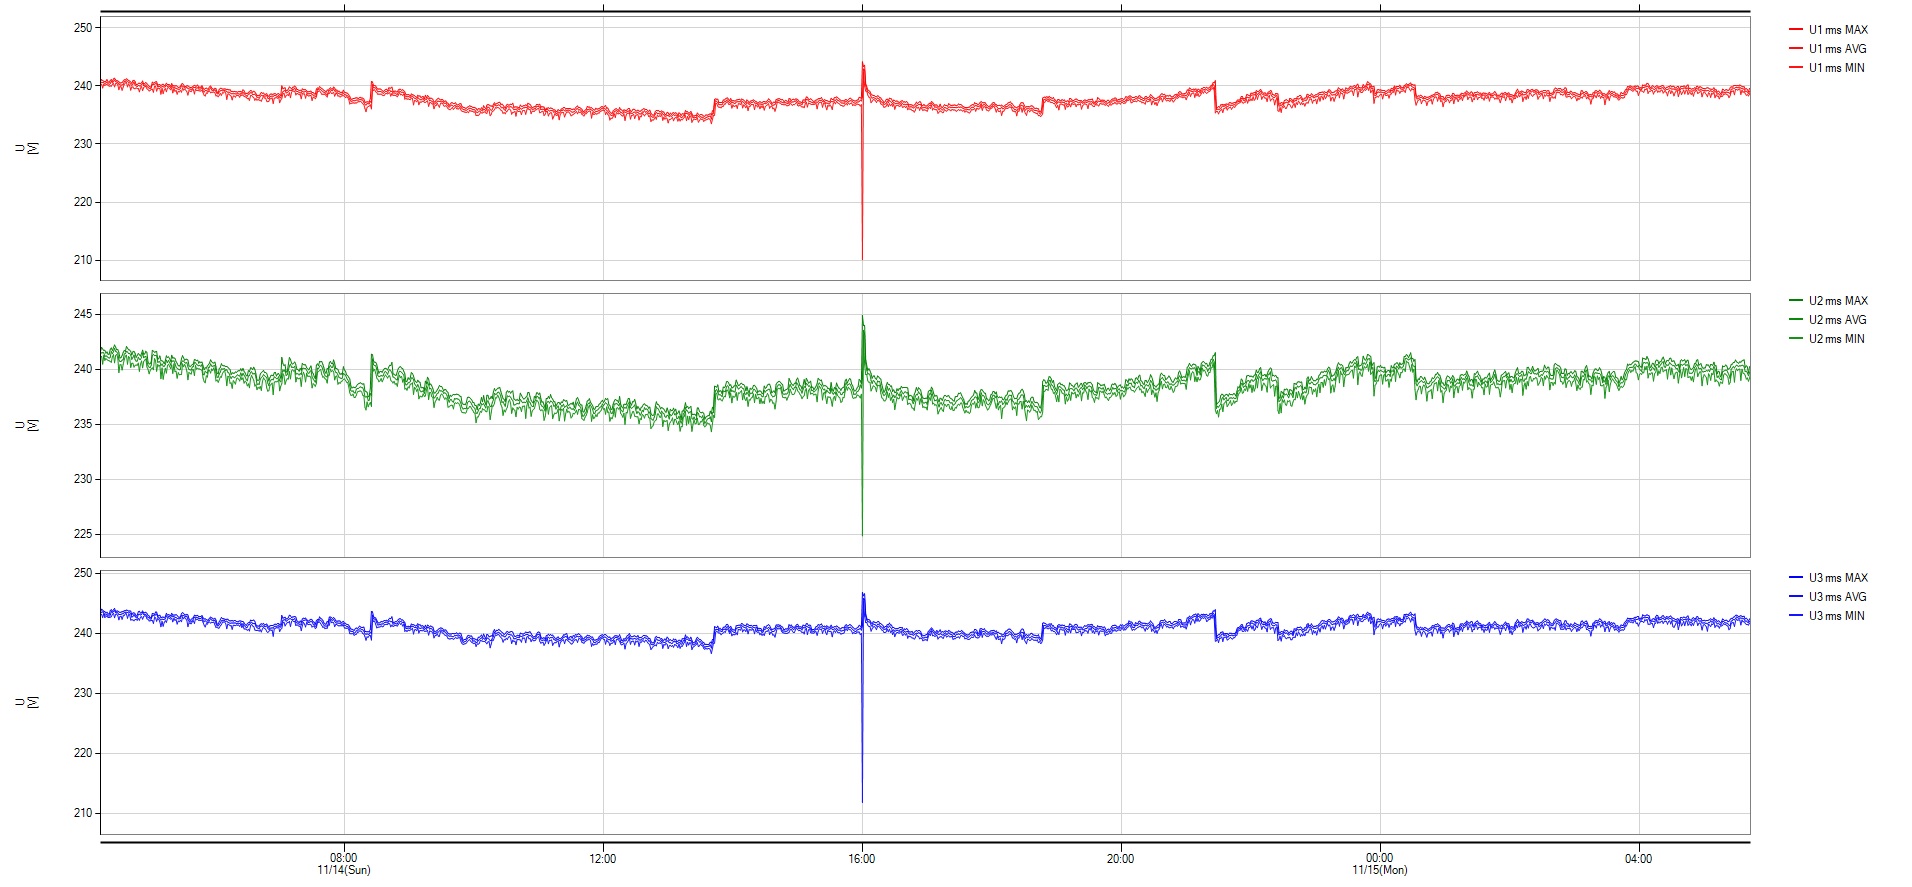
What is seen on the second trend graph here is also what is usually obtained when one uses a standard power logger. Hence the difference (in capability) between a PQ analyzer and a power logger, is clearly illustrated here.
Trend Analysis
Without an event capture, it will be impossible to ascertain the actual duration of this voltage dip. However, based on the differences in the two trends (Vrms 1/2 vs Vrms) minimum values, we can tell that this dip was definitely less than 10 cycles ( < 200ms).
This monitoring was done at Low Voltage (monitored at 3P4W) in a commercial complex along Orchard Road, with V1 and V3 dropped significantly (dip by about 40%) and V2 slightly lesser (dip by about 17%). Comparing with its loading/current trend suggests this was an event upstream of the monitoring point.
Looking upstream at 22kV, dip magnitudes at 22kV will be similar (i.e 22kV dip magnitude V12 will be similar to LV V1). At 22kV, for a voltage dip of such characteristics, it was likely an event originating from a higher voltage level (you may refer to other voltage dip posts on this).
Feedback from other PQ monitors island-wide supports this. This was a transmission-level voltage dip event. The trend results suggest that it was a single-phase (L1) transmission level fault.