Harmonics From Solar PV Inverters

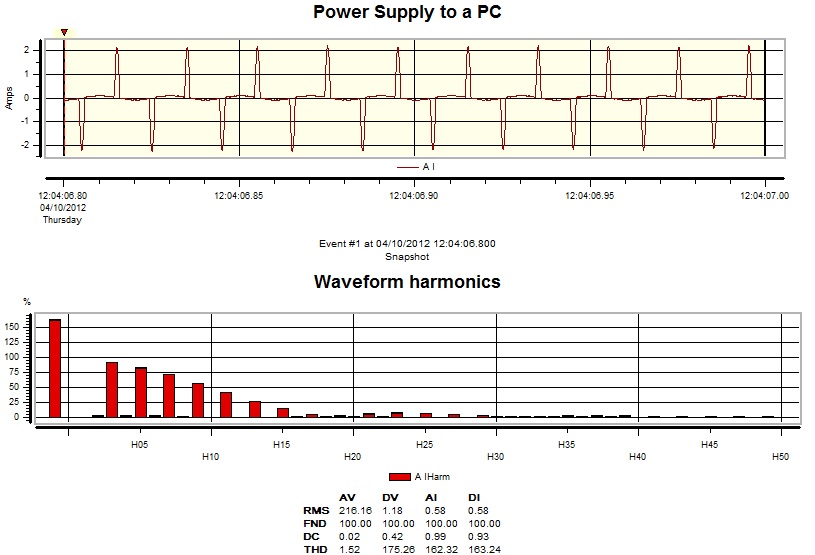
In general, current harmonics contribution from solar PV inverters do not pose much of a power quality problem. Its ITHD is usually small and negligible as compared to a harmonics-producing load such as a variable speed drive (ITHD for a typical 6-pulse drive ranges between 30% – 50%).

Typically, one will find a Current Total Harmonic Distortion of 3% stated in the datasheet for a quality-brand inverter, as seen here.

Typical Inverter Datasheet THDI 3 percent

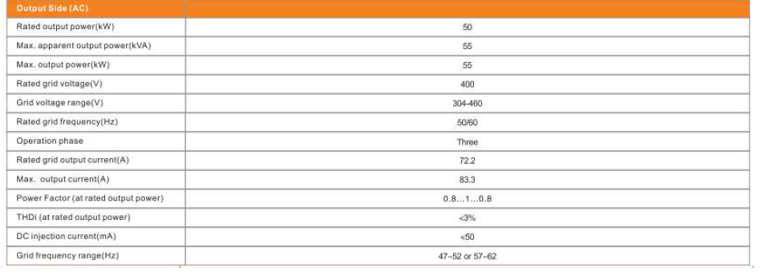
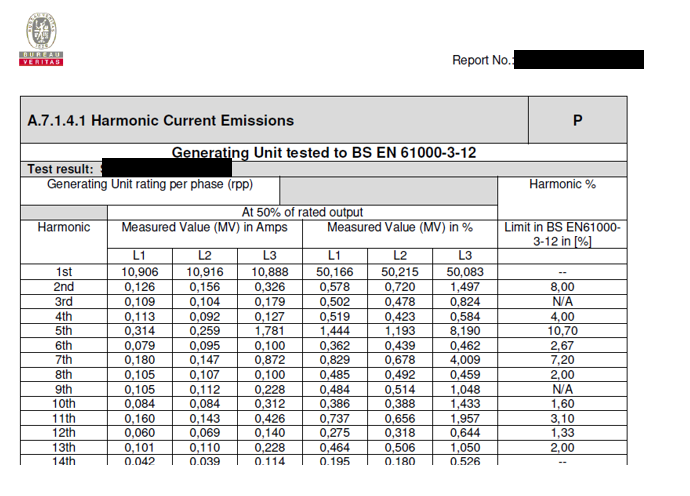
In Singapore, for a Grid-Tied Solar PV connection, the Licensed Electrical Worker (LEW) (i.e Qualified Person) will have to submit the inverter’s PQ-related type test report to the Grid operator (SP Group). Below is one such example – here it shows the portion whereby the inverter was tested as part of the UK Engineering Recommendation G99 test requirements. Values stated for quality-brand inverters will have its harmonic current emission values well within the limits.

Harmonic Current Emissions Test - Part of ER G99 test requirements

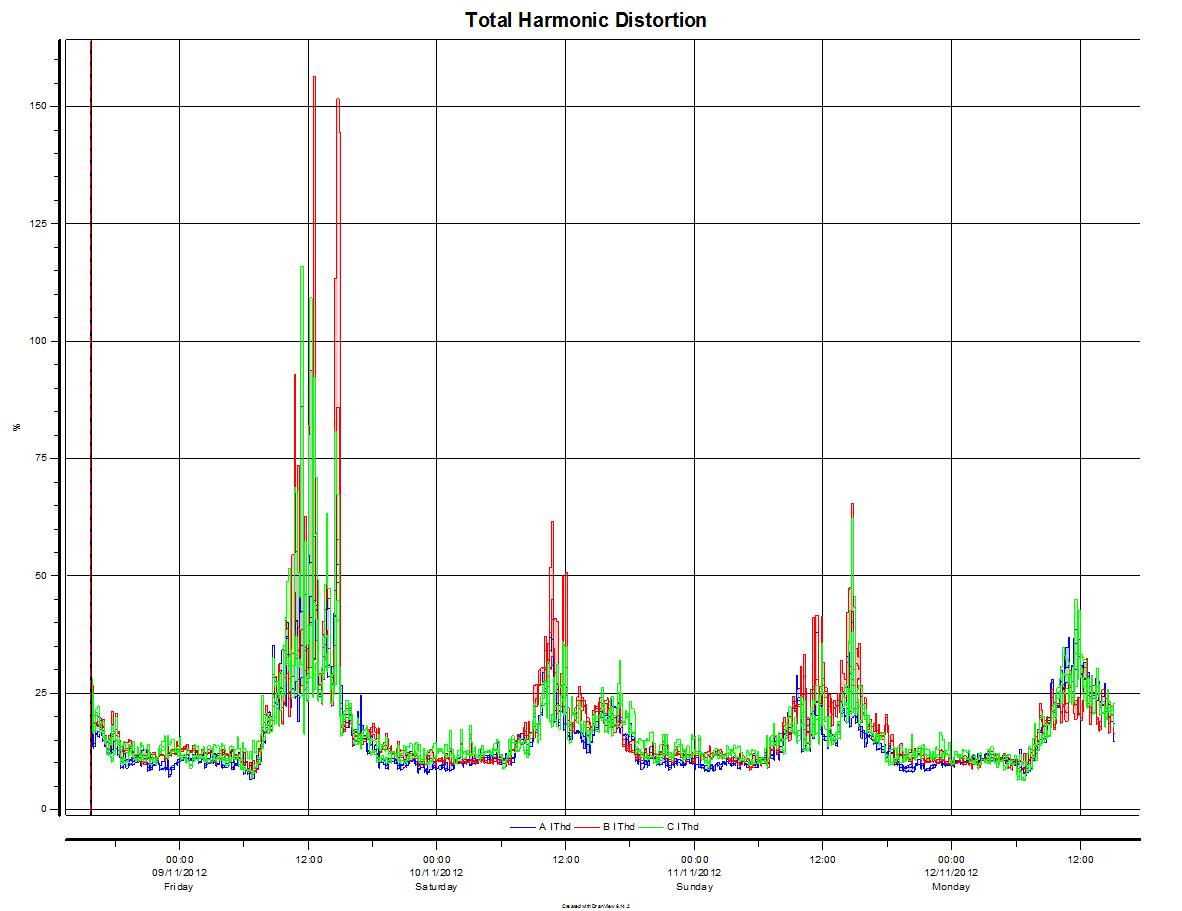
You may wonder – One inverter is ok but how about a number of them accumulatively? I had the opportunity to measure numerous sites whereby the rated PV output was accumulatively more than 1MWac.

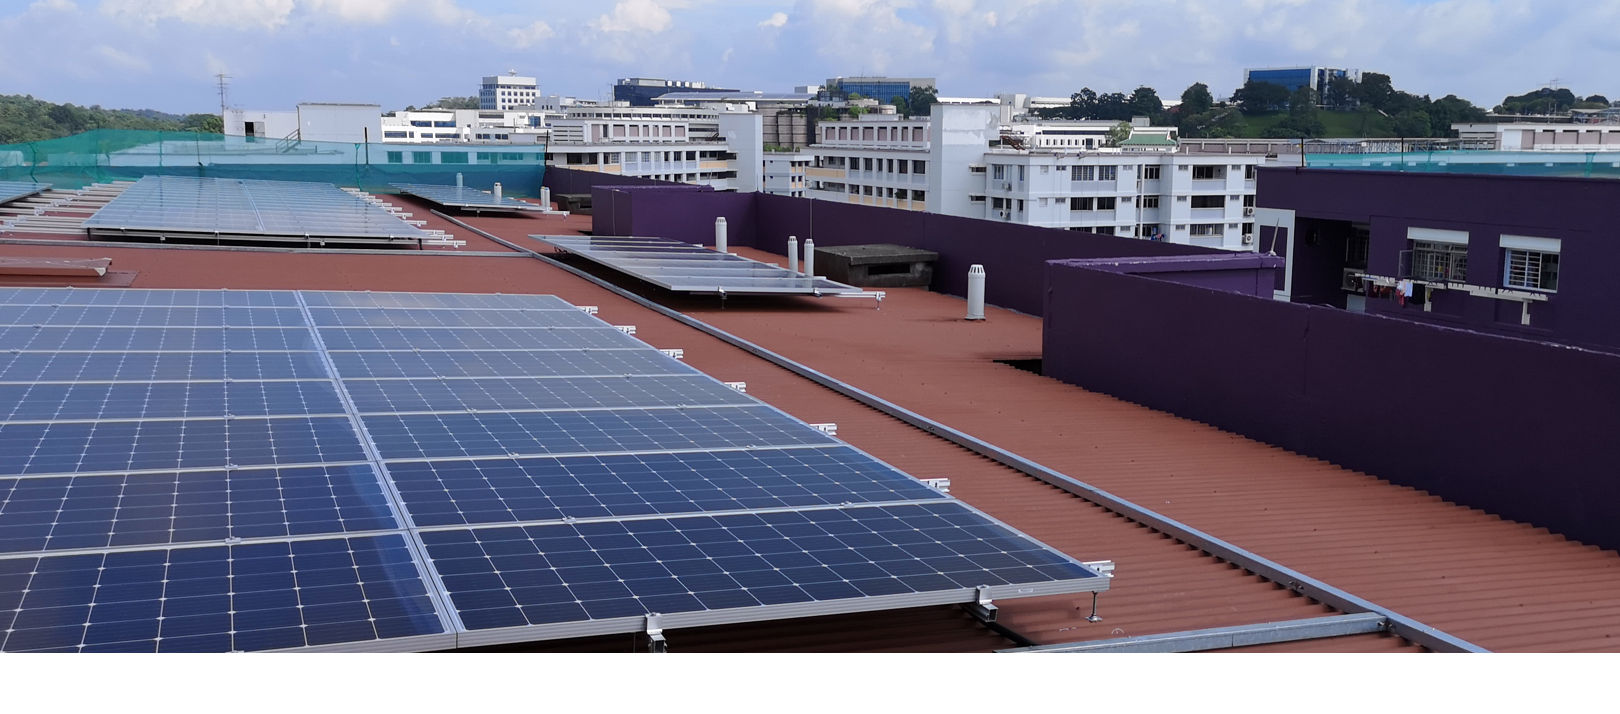
Here are two sites whereby the background harmonics can be considered to be on the low side and as such the effects of the on-site inverters were more representative (limited ‘contributions’ from the localized electrical network).

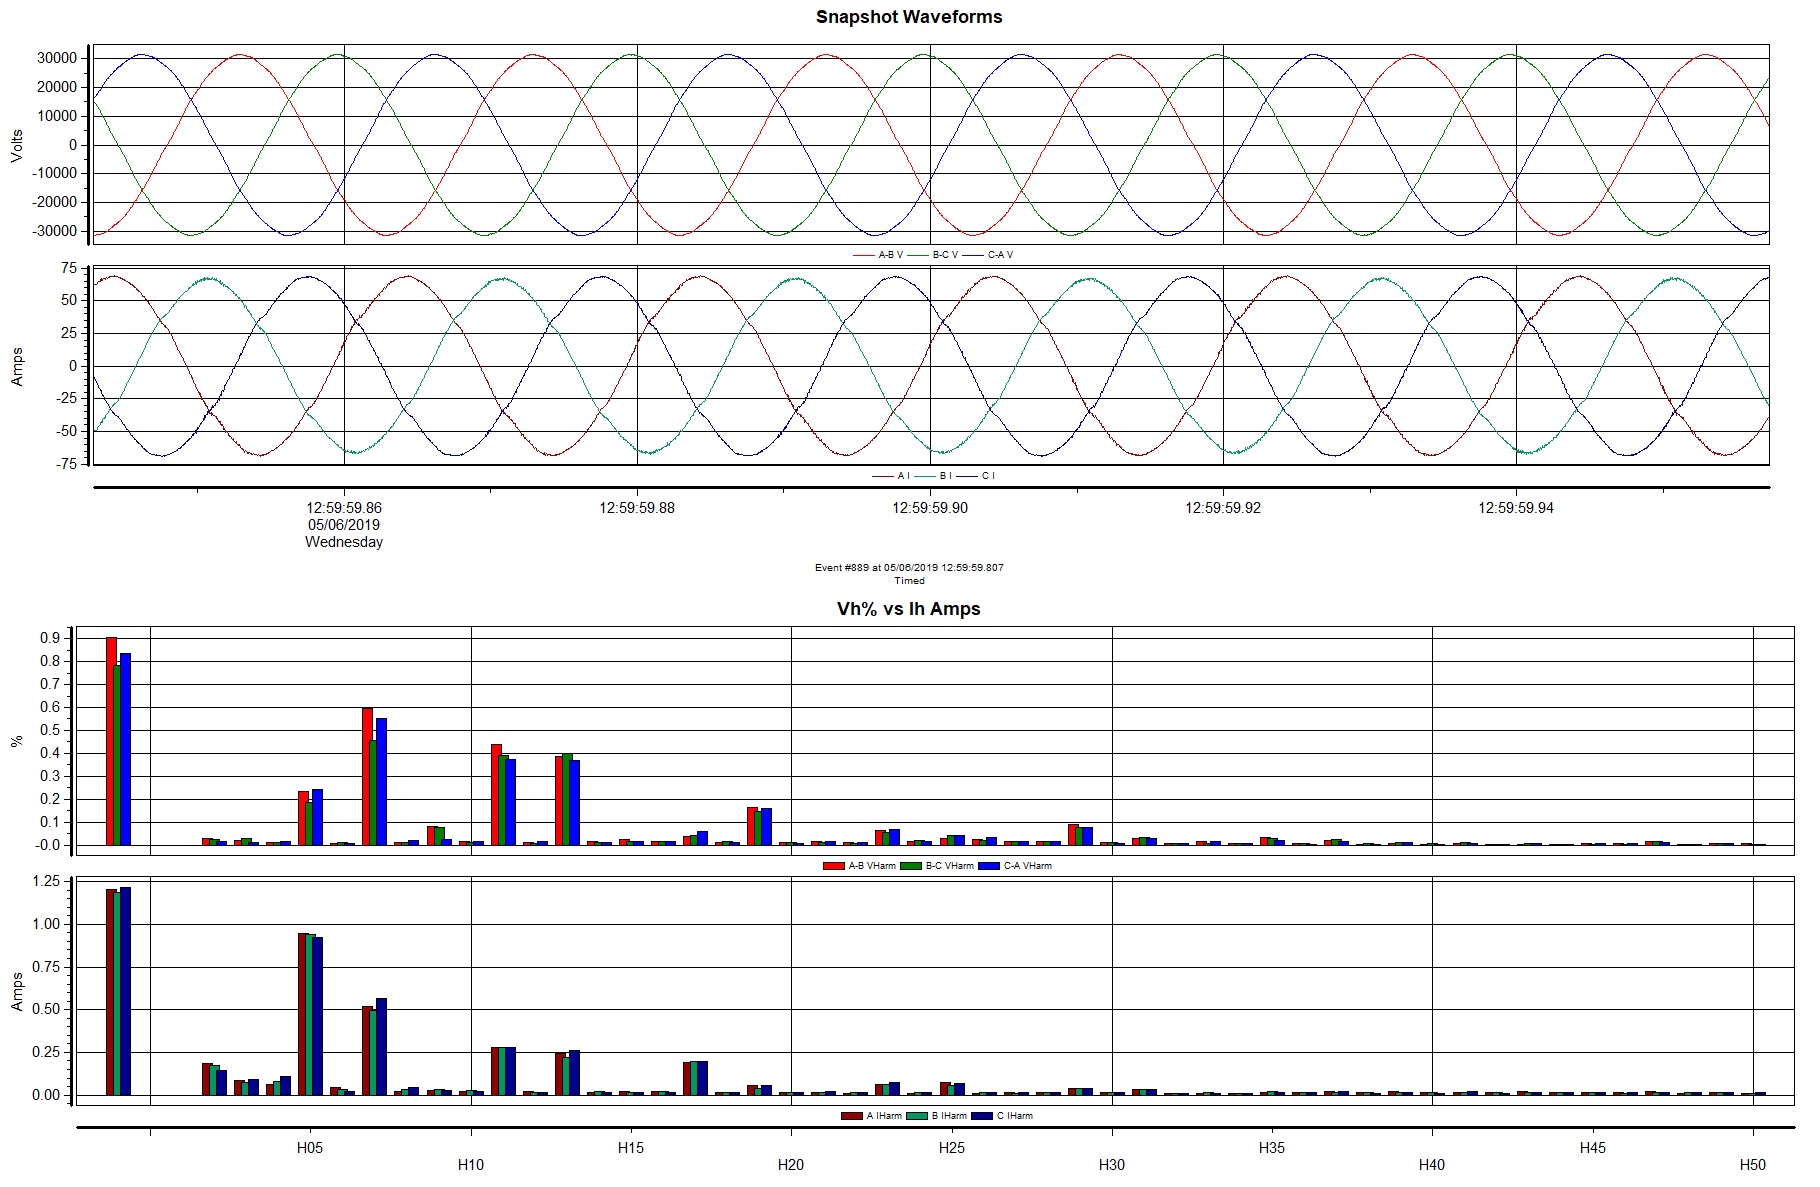
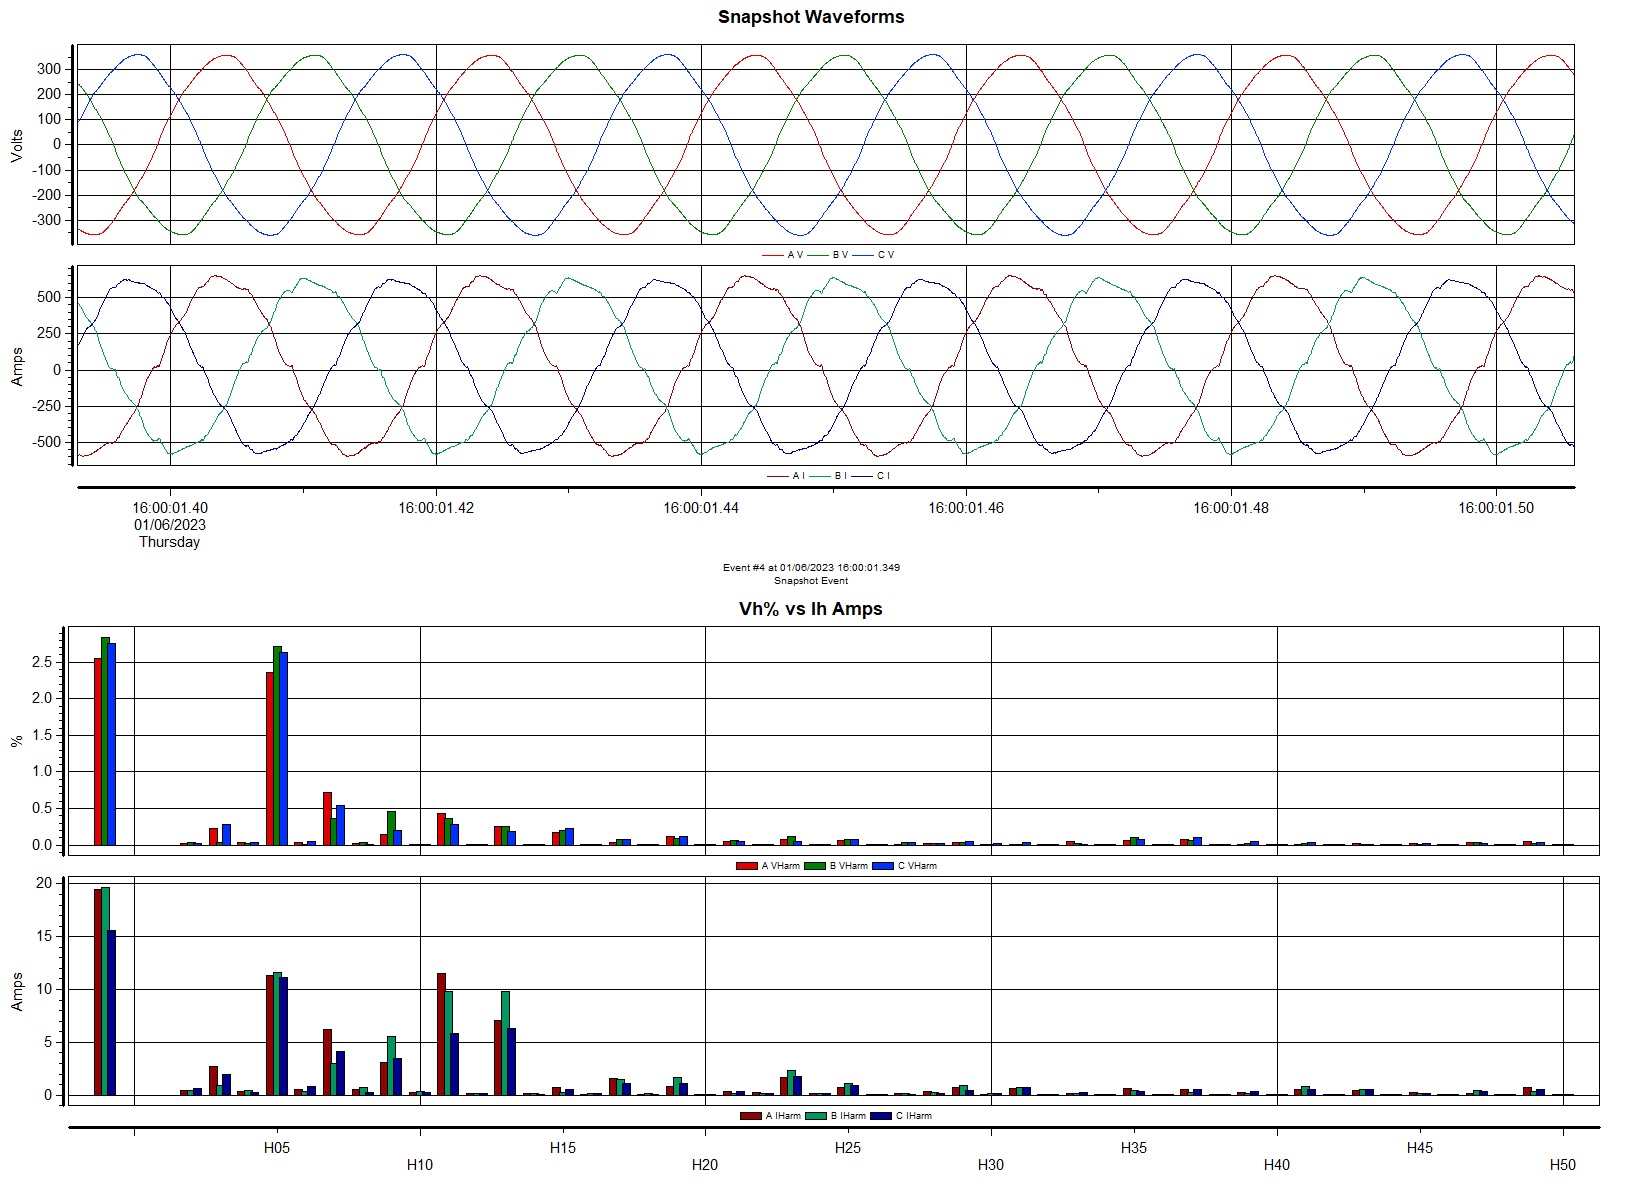
All measurements were done using an IEC 61000-4-30 Class A certified Power Quality instruments.

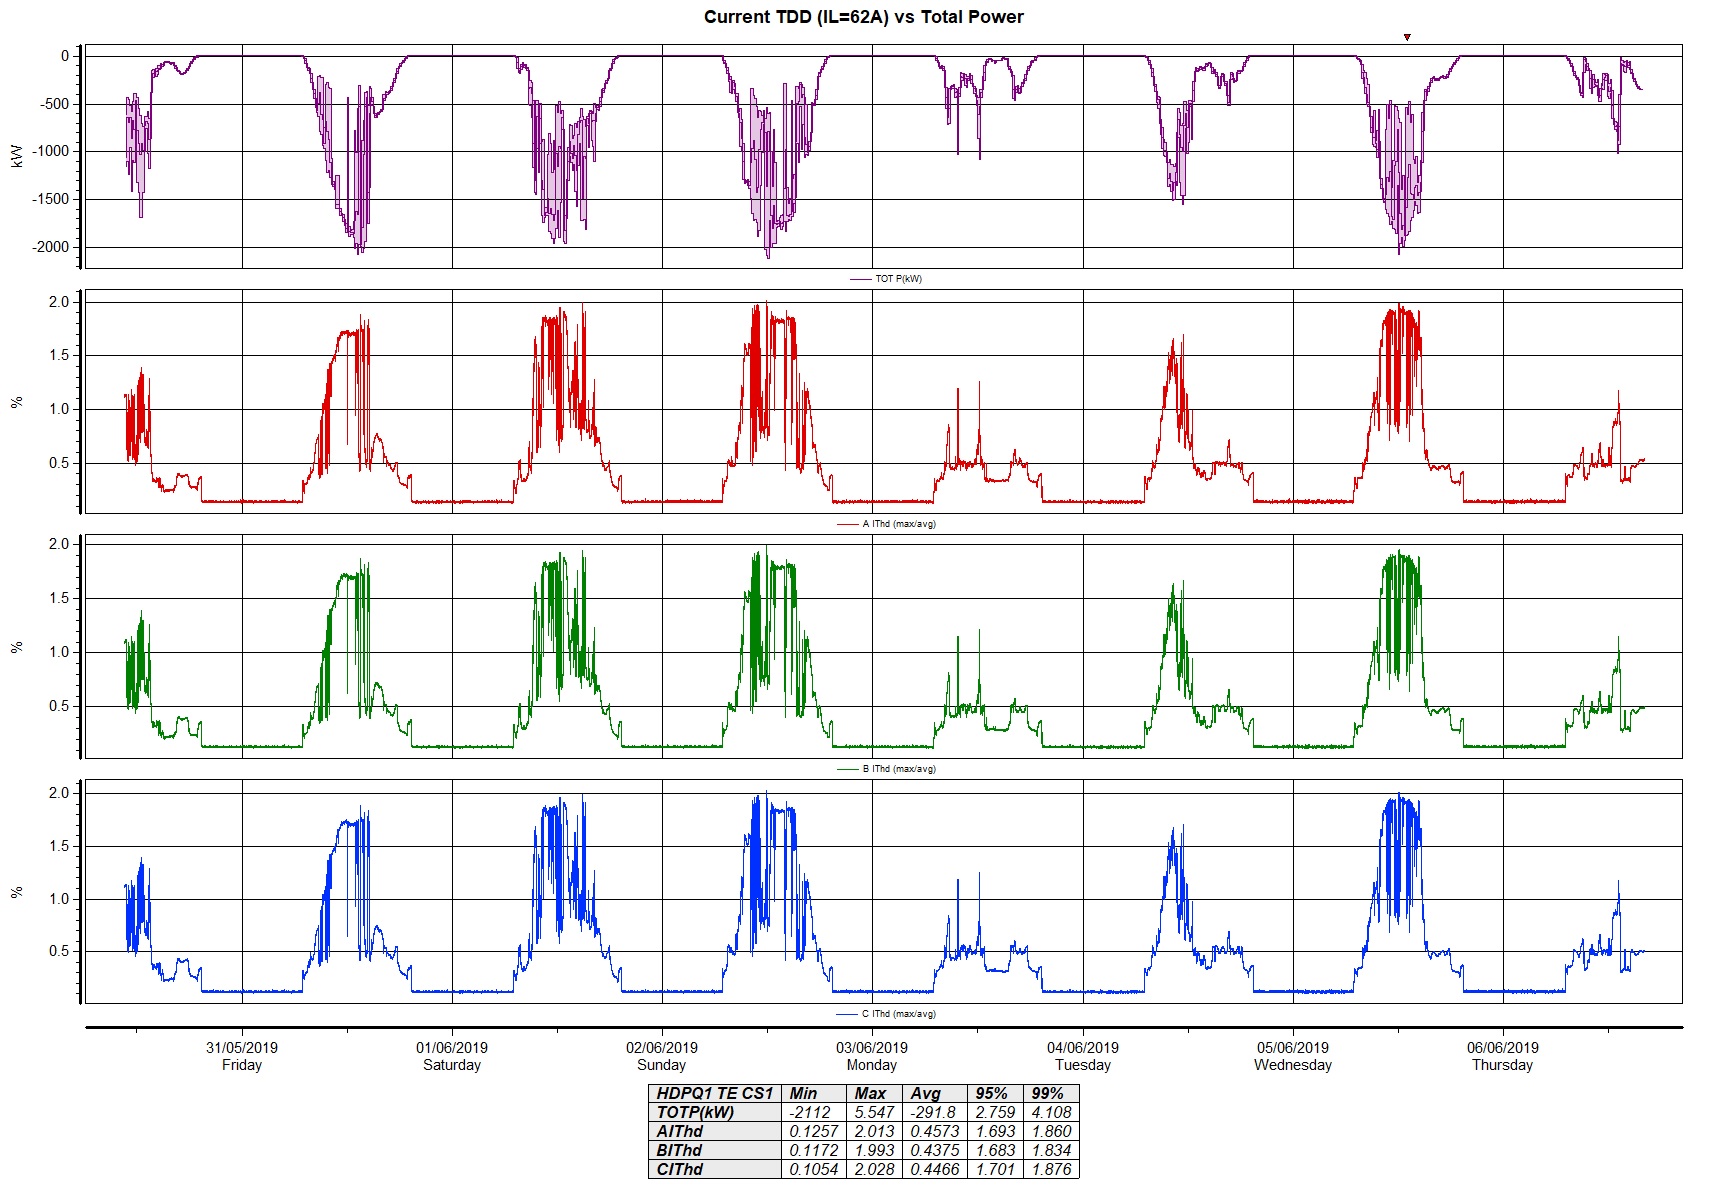
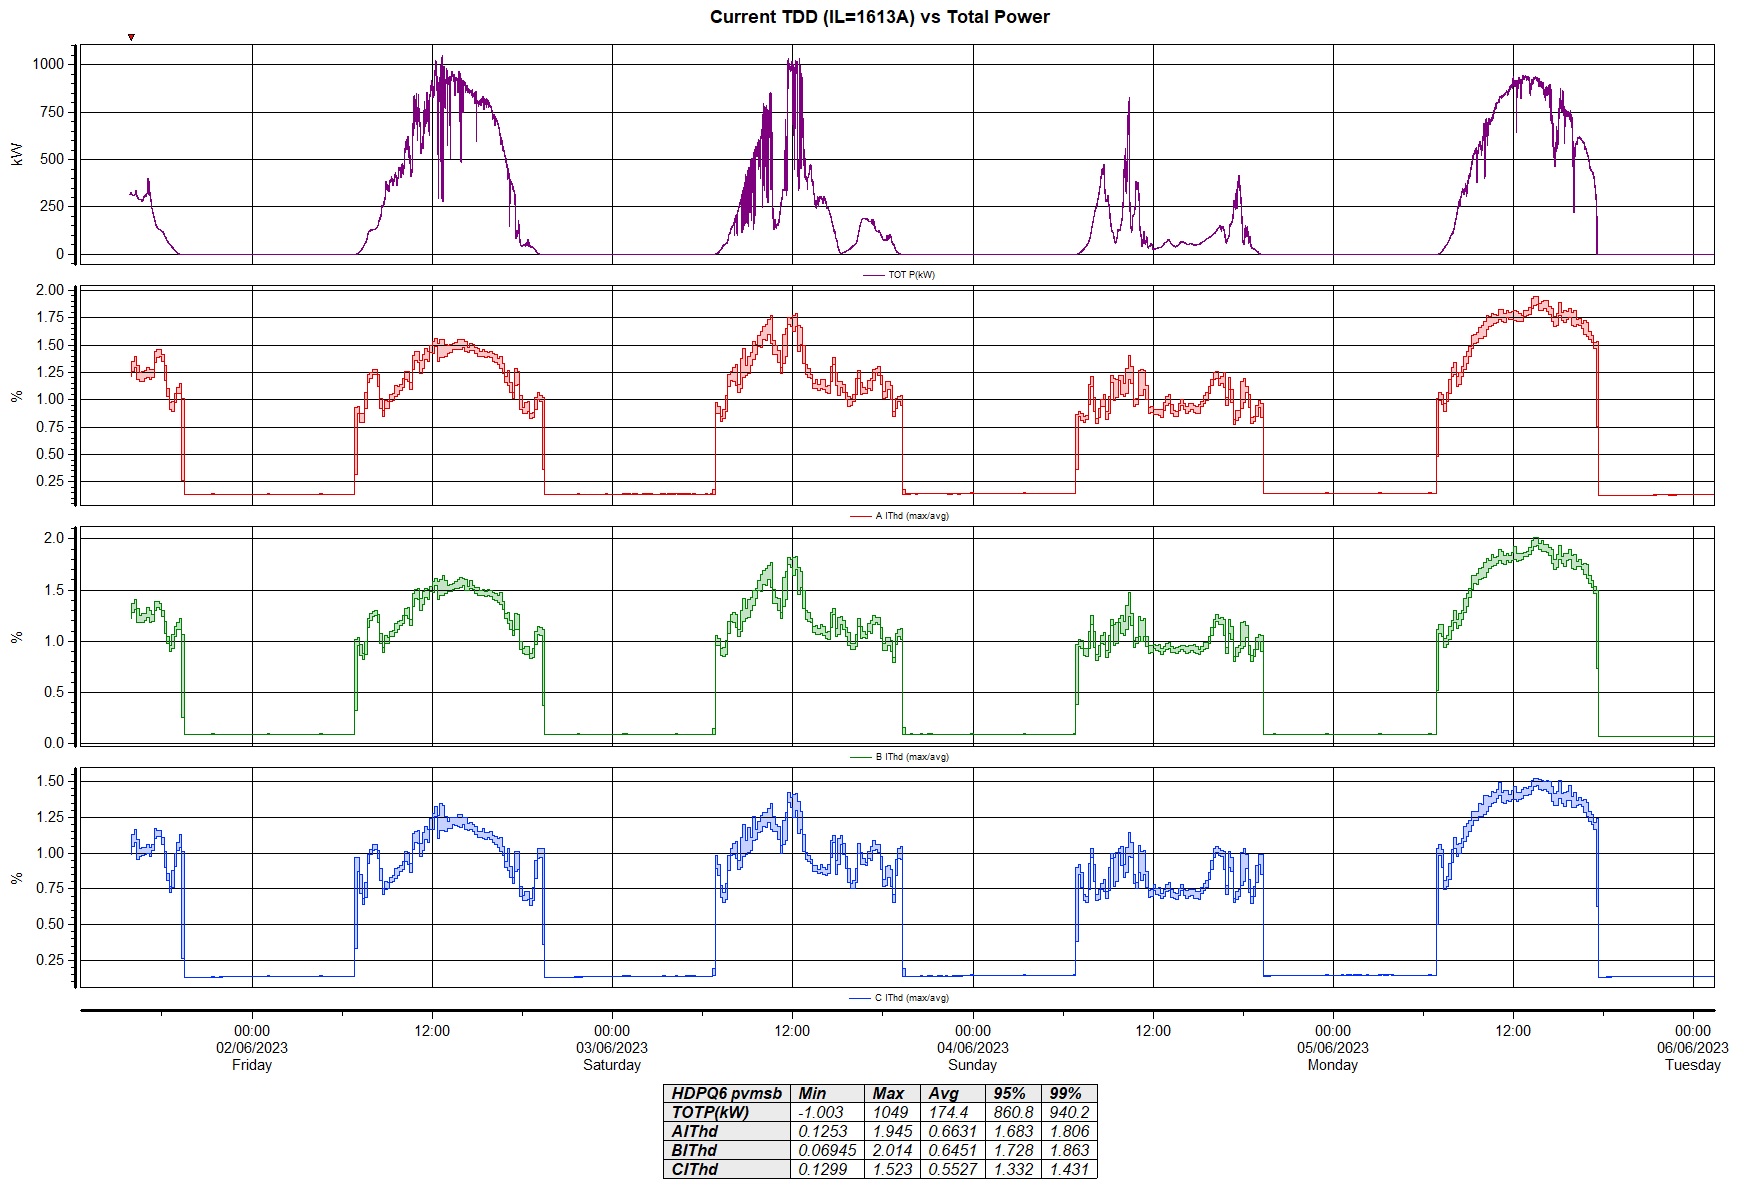
The Current Harmonic Distortion (ITHD) in the trends below have been scaled to the respective aggregated inverters’ rated current (in other words, shown here as Total Demand Distortion (TDD) values).

As observed here, the TDD values were less than 3% and the sinusoidal shape of the current waveforms were very much still visible.

Note: IEEE 519 recommends TDD values of 5% for power generation facilities.

Site #1:

Premises Type: Warehousing / logistics
PV Size: 1352.8 kWp
Aggregated Inverter(s) Rated Current = 1613A @ 400V.
Measurement Point: 2500A PV-AC DB, directly connected to the Premises 5000A Main Switchboard (served by a 3MVA transformer) via 3000A flexible CTs (clamped on 3 sets of 500sqmm cables per phase).
CT direction towards MSB as Load, PV as Source.
VTHD: 0.89% – 3.96% (CP95: 3.6%).

Site #2:

Premises Type: Solar Farm (On-site loads: Auxiliary power and lighting loads only)
PV Size: 2652kWp (for CS1)
Aggregated Inverter(s) Rated Current = 62A @ 22kV (for CS1).
Solar inverters connected at 400V, stepped-up to 22kV via a 2.5MVA transformer.
Measurement Point: 22kV Incomer 1 from PowerGrid (CS1) via VT and CT.
Note: Solar Farm has 2 x 22kV intakes from PowerGrid – only one intake shown here.
CT direction towards PV as Load.
Solar Farm was connected to a Lightly-loaded 22kV distribution network.
VTHD: 0.59% – 1.22% (CP95: 1.09%).

Mr. Harmonics II

Harmonics gets people confused all the time. Some typical remarks will be like; “the neutral current harmonics are extremely high” or “burnt marks on the isolator were caused by harmonics”.

Here are 3 simple guidelines for harmonics in general LV applications.

  1. Keep Voltage THD% below <5%. While there has been revisions in standards like IEEE-519 (revising upward from 5% to 8% for LV), trust me, keeping VTHD < 5% will make life easier for everyone (utility, facilities dept and end-users).
  2. “Total harmonic content of the load current not exceeding 5% of rated current.” This is stated as one of the normal service conditions for a standard distribution transformer. Thus, it is a good practice to keep the total current harmonics < 5% of the transformer’s rated current (eg. 1MVA 22kV/0.433kV TF – rated current 1333A; total harmonic current shall be less than 67A).
  3. Current THD% may gives you misleading results (see my other post – Mr. Harmonics I). One needs to see the actual current harmonics in absolute terms (amperes), total RMS current and make reference to the corresponding cable / circuit breaker sizes, before deciding on the next course of action.

Missing Earth Loop Impedance On One Phase

Came across an interesting case recently, whereby the engineers taking care of a particular shopping mall had failed to obtain an earth loop impedance value on just one of the phases. Issue came to light as the electrical inspectors failed to obtain a complete earth loop results for the new tenants that are setting up shop in the mall.

Was called in to investigate if power quality is a factor here.

Background
– Similar “incomplete” earth loop values were obtained at the LV Main Switchboard. “OL” when measured between Phase L1 and Earth. Had used different sets of earth loop testers.
– Thorough checks were conducted on the distribution transformer, earth cables and the neutral-ground connection at the transformer.
–  Loads on this particular switchboard include the building’s chiller systems and some tenants’ loads.
– Was reported normal earth loop values could be obtained when the chiller system is not in operation.

Recall: Earth Loop Impedance Test
– One of the tests conducted for an Electrical Installation “Pass” Certificate.
– To ensure when a fault occurs in an electrical installation, sufficient current will flow to operate the fuse or circuit breaker protecting the faulty circuit within a pre-determined time.

Recall: Earth Loop Tester
– Operates by inducing a current from the Supply system, by introducing a calibrated load between the phase conductor and the protective earth.
– And then monitors the voltage difference.
– Comes in various forms (Multifunction tester vs. Dedicated tester); (3-wire types L+N+E vs 2-wire types L+E)

Earth Loop in a TNS

Findings
– Conducted separate earth loop tests at LV Main Switchboard and monitored the quality of supply.

earth loop tester and pq monitor

– Apart from one failed attempt via the multifunction tester, subsequent tests produced repeatable earth loop impedance values across all the 3 phases.
– “OL” when measured between Phase L1 and Earth, used “K-brand” earth loop tester(s).
– VTHD on “high side” but expected due to the a few nos of variable speed drives being used at the Chiller system.
– Phase L1 – noticed multiple zero crossings.

Conclusion
– The quality of the supply waveform on Phase L1 affected / influenced the operability of the other earth loop testers, resulting in giving “OL” readings. An interesting case!
– Newer earth loop testers do have a ‘harmonic component’ – to cater for (IEC 61557-3:2007).

Mr. Harmonics

Mr. Harmonics is frequently being blamed when an equipment failed (or when a cable burnt, capacitor bank blown, or a circuit breaker tripped without an obvious fault). Some without due consideration of other simpler factors will blame Mr. Harmonics and his cousins like Mr. Resonance (or perhaps his friend, Mr. Transient – story for another day) straightaway.

Surprisingly, it is a fairly easily accepted reason here. And with power quality instruments getting more affordable these days, it has been becoming quite common to see someone using this new toy, measure current harmonics in percentages of 50-80%, and straightaway concluded that it is indeed a harmonics problem.

Firstly, when it comes to harmonics, we need to know; is it voltage or current harmonics? While there is a common indicator to measure both of them – using the Total Harmonic Distortion (THD) formula (RMS value of the harmonic content expressed as a percentage of the fundamental), one needs to know the pros and cons of using such indicator when applying to voltage/current harmonics.

Usefulness of THD

  • provide a good indication of how much additional heat will be realised when a distorted voltage is applied across a resistive load
  • give indication of the extra losses caused by the current flowing thru a conductor

Limitations of THD

  • unreliable indicator of voltage stress within a capacitor (look out for the peak value instead not THD)
  • a meaningful indicator for voltage harmonics, as voltage varies only a few % (as referenced to its fundamental)
  • not so the case for current harmonics as a small current may have high THD but not a significant threat to the system; can be extremely misleading.

sample Iharmonic waveform/spectrum
Fig1. sample Iharmonic waveform/spectrum

Here in Fig1, is the current waveform and spectrum of the common switched-mode-power supply to our PC/laptop at work or home. Looking at just its THD% current, one will be extremely alarmed (162%!!). So should all of us purchase harmonic filters for all our homes/offices then? (fact: the actual amperes of this circuit is less than 0.6Amps, and VTHD  is only 1.52%)

When it comes to current harmonics, it will be more meaningful to use other alternative indicators such as Total Demand Distortion (TDD), or use absolute amperes (my personal recommendation).

Fig 2 and 3 shows the trending results of current harmonics, presented in THD%, Harmonic Amps and TDD%.

Total Demand Distortion

  • Current THD is misleading during light load conditions (when I1 is small)
  • Similar to THD, except that the distortion is expressed as a percentage of some rated load current magnitude rather than as a percentage of the fundamental.


Fig2. In THD%
Fig2. In THD%


Fig3. Harmonic Amps and TDD%
Fig3. Harmonic Amps and TDD