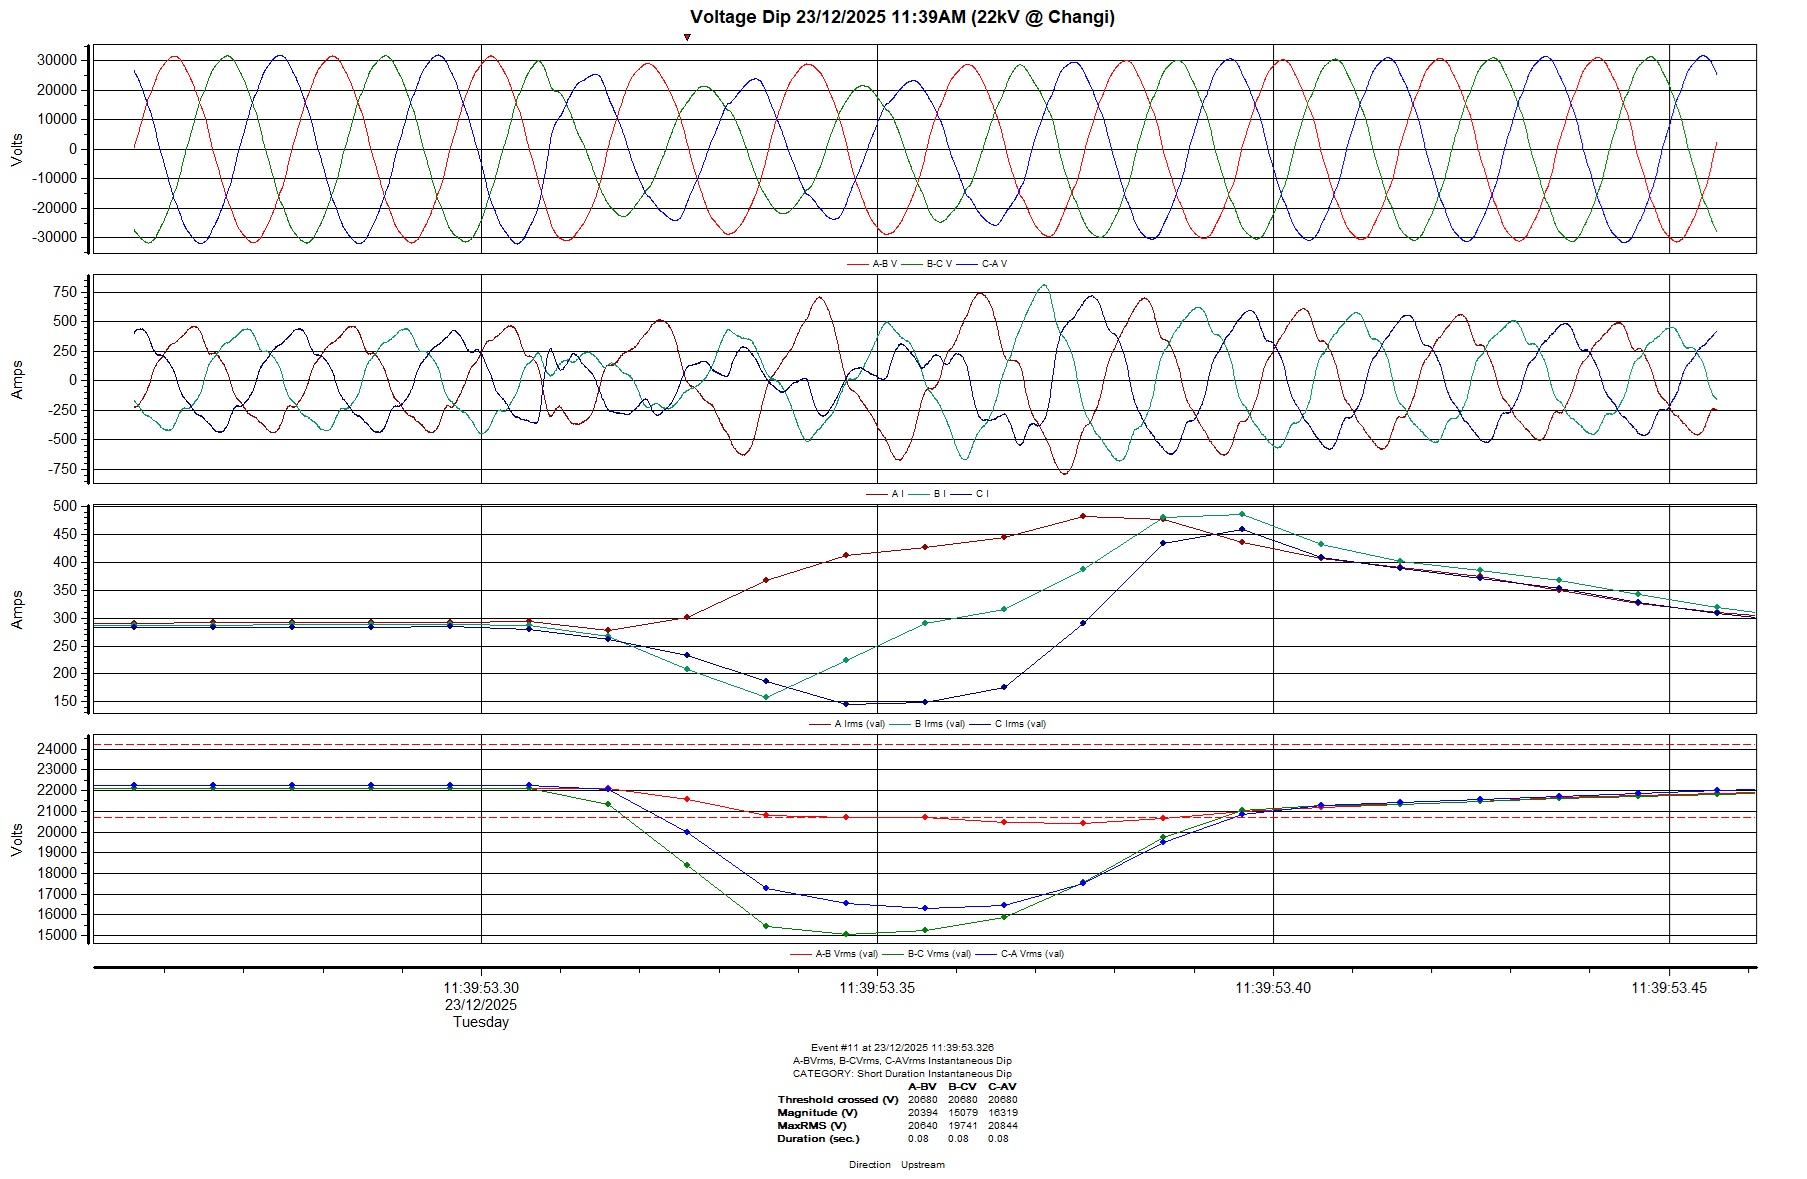
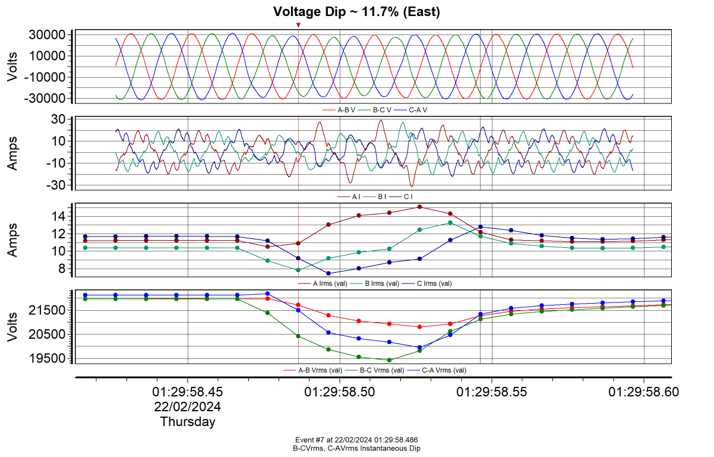
Earlier in the week, on Tuesday 23/12/2025 at approximately 11:39AM, a transmission level fault occurred. The East region (North-East to be exact) was affected the most, with dip-by values in the range of ~ 30%.
Below were from some our sites in the same affected region at 22kV and LV in Changi and Bedok areas respectively.
When a 230kV fault occurs, a quarter of Singapore will feel the worst dip magnitude (the region where the fault occurs), with the other 3 regions observing shallow voltage dips.
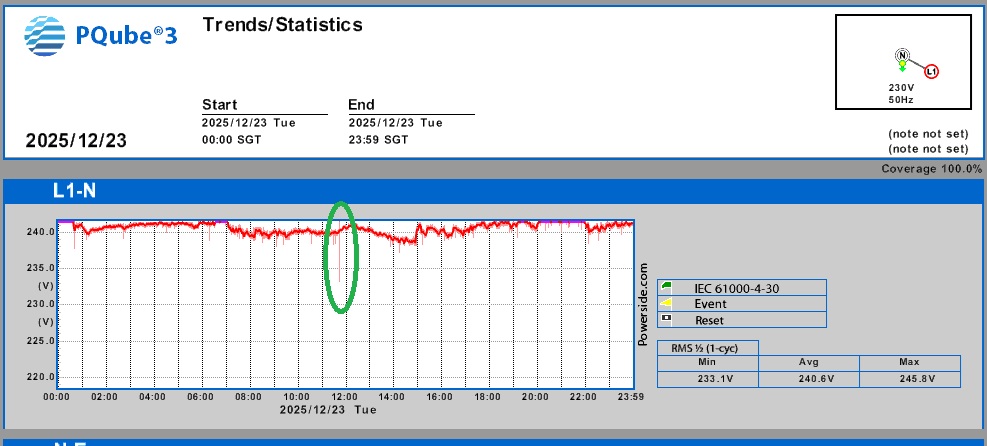
For my home’s PQube3 in the west, it was a non-event, as seen below.
The fault originated from Malaysia’s TNB network (fault on Phase L3).
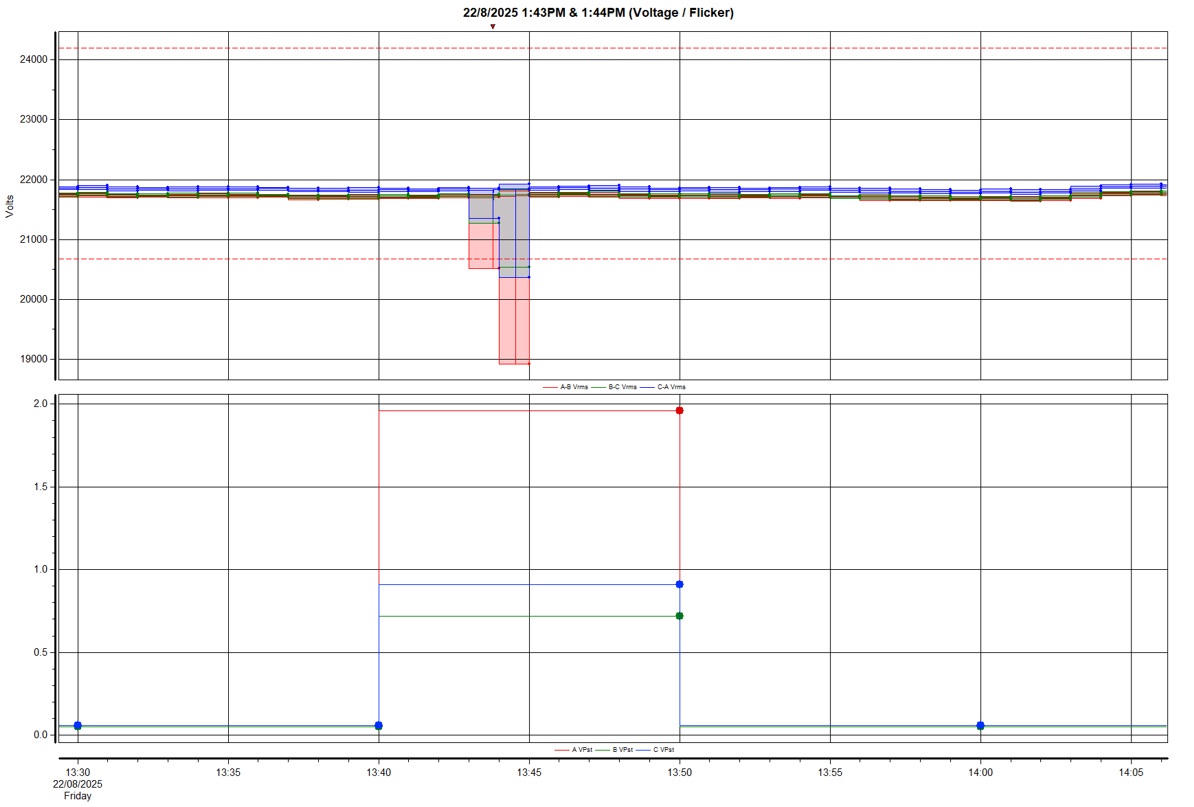
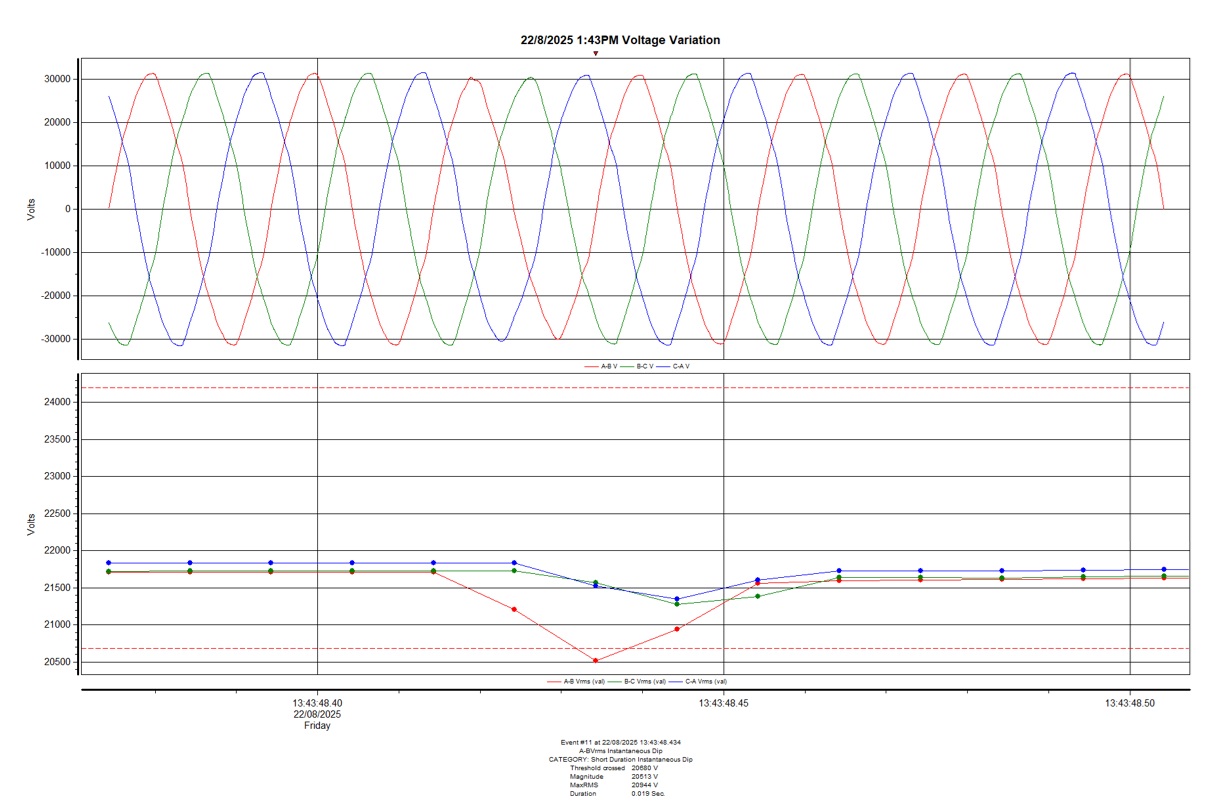
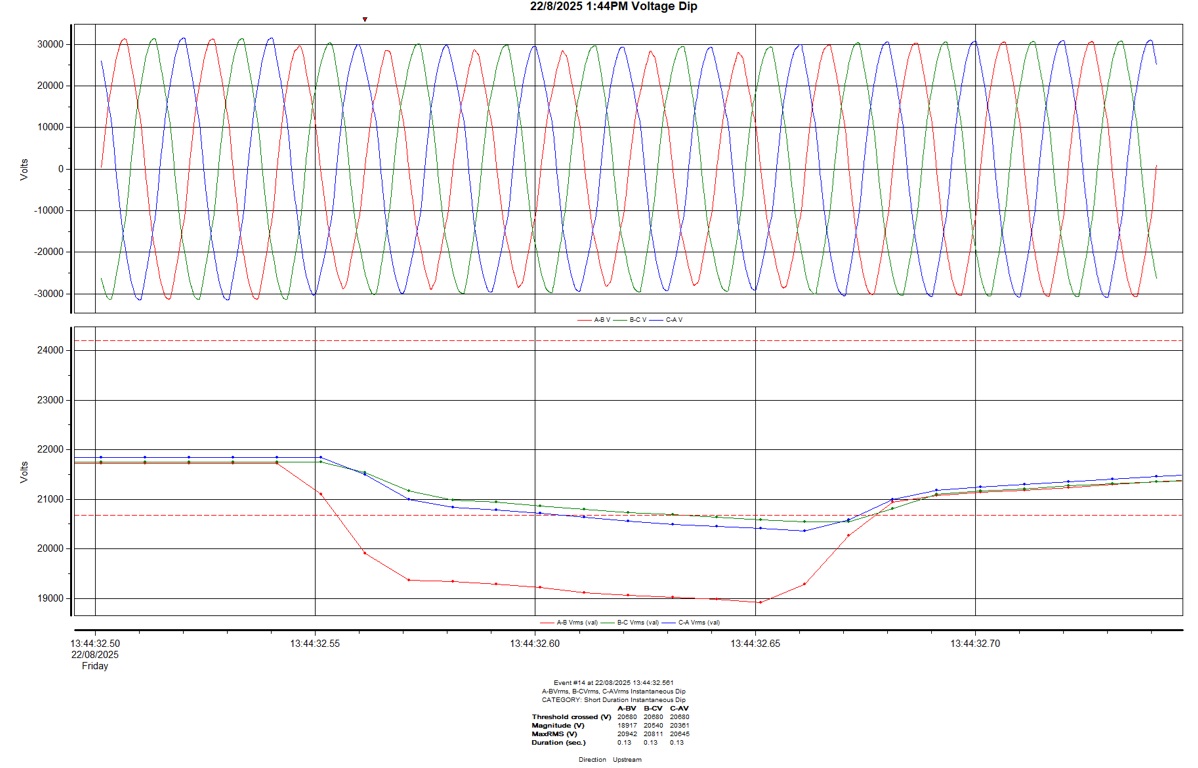
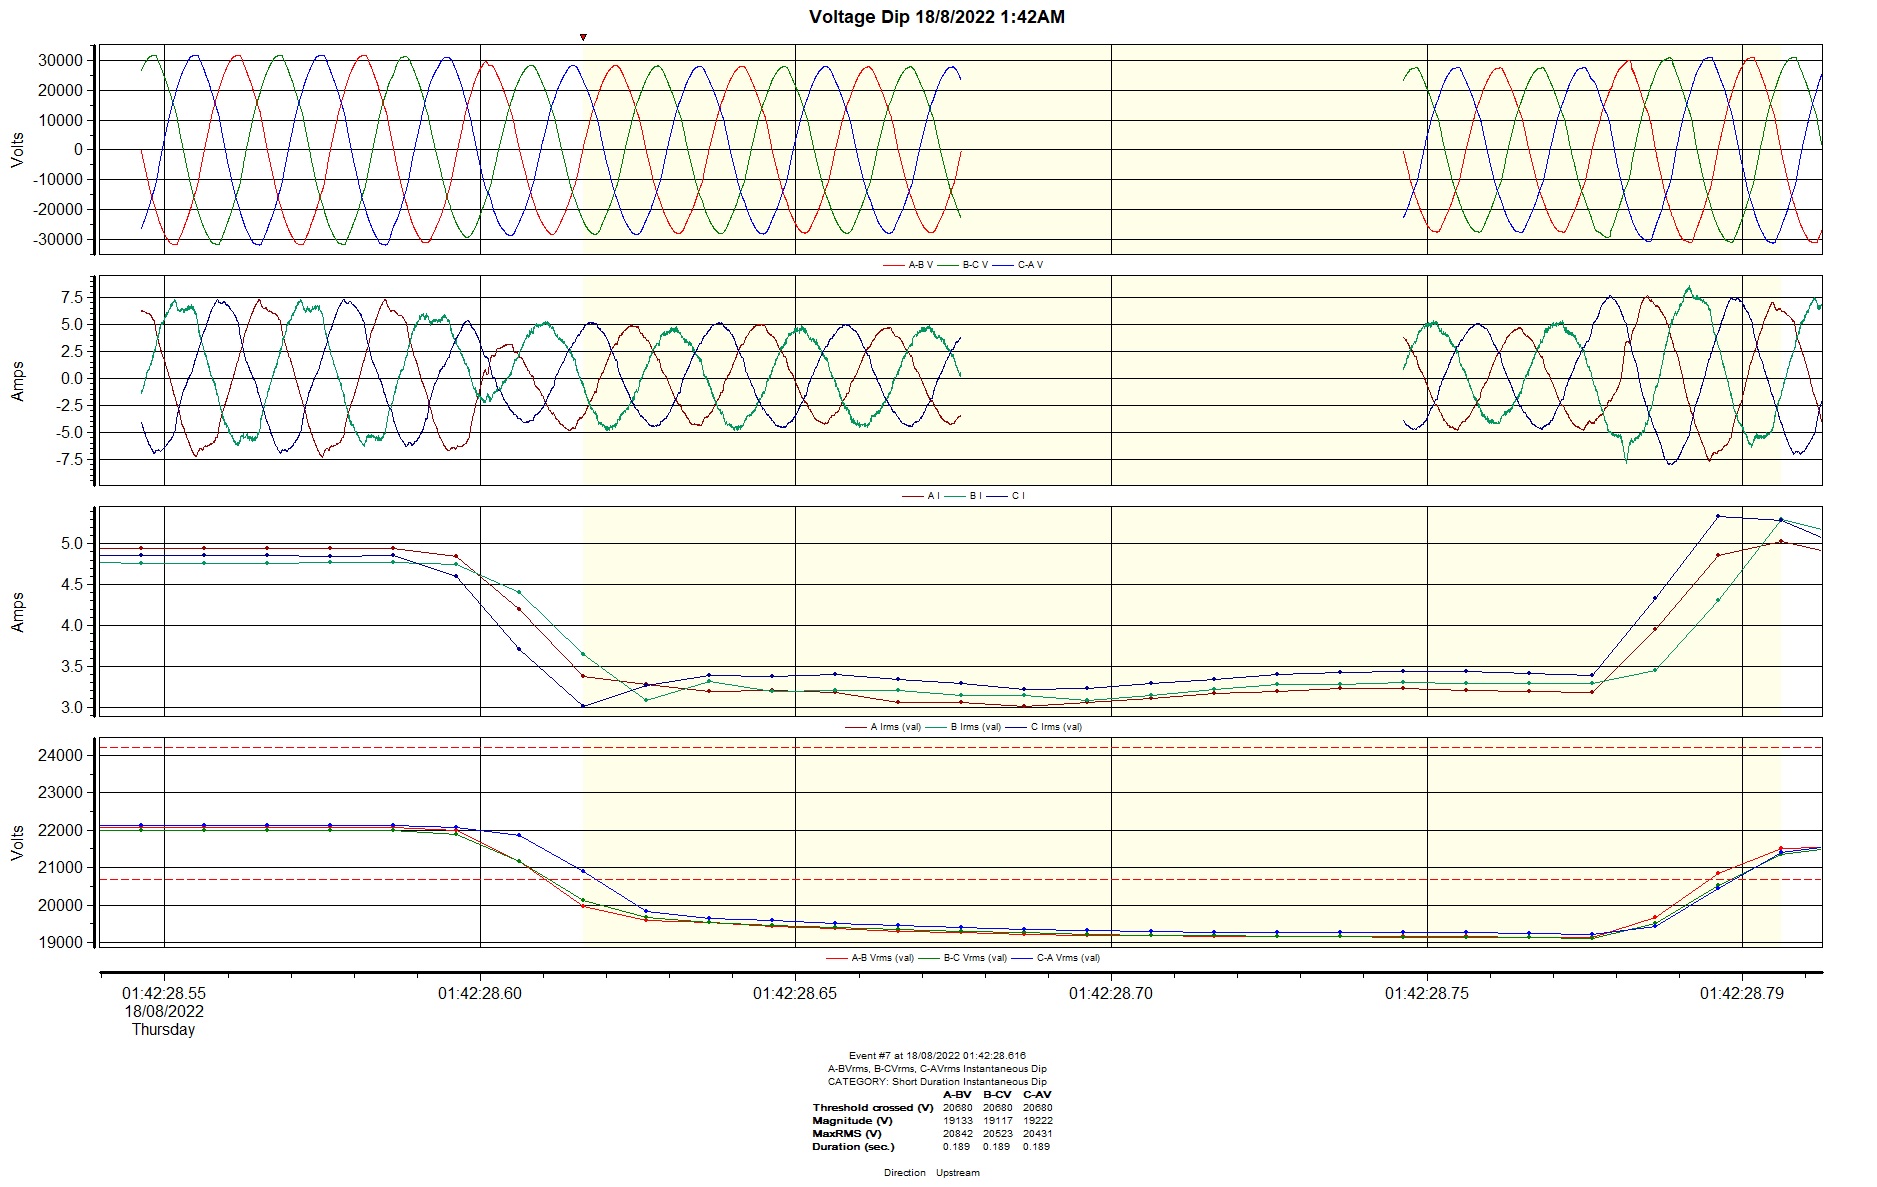
A recent power quality measurement at 22kV recorded a rare occurrence, whereby there were two related events occurring within a minute apart of each other.
Likely, it was due to a fault developing in the first instance (and self-cleared itself), followed by the ‘full-blown’ fault.
We were informed that it was a 22kV cable fault (faulted phases: L1 & L2) on an adjacent distribution network (i.e fault in another 22kV network, ‘connected’ to our measurement point via the 66kV network path).
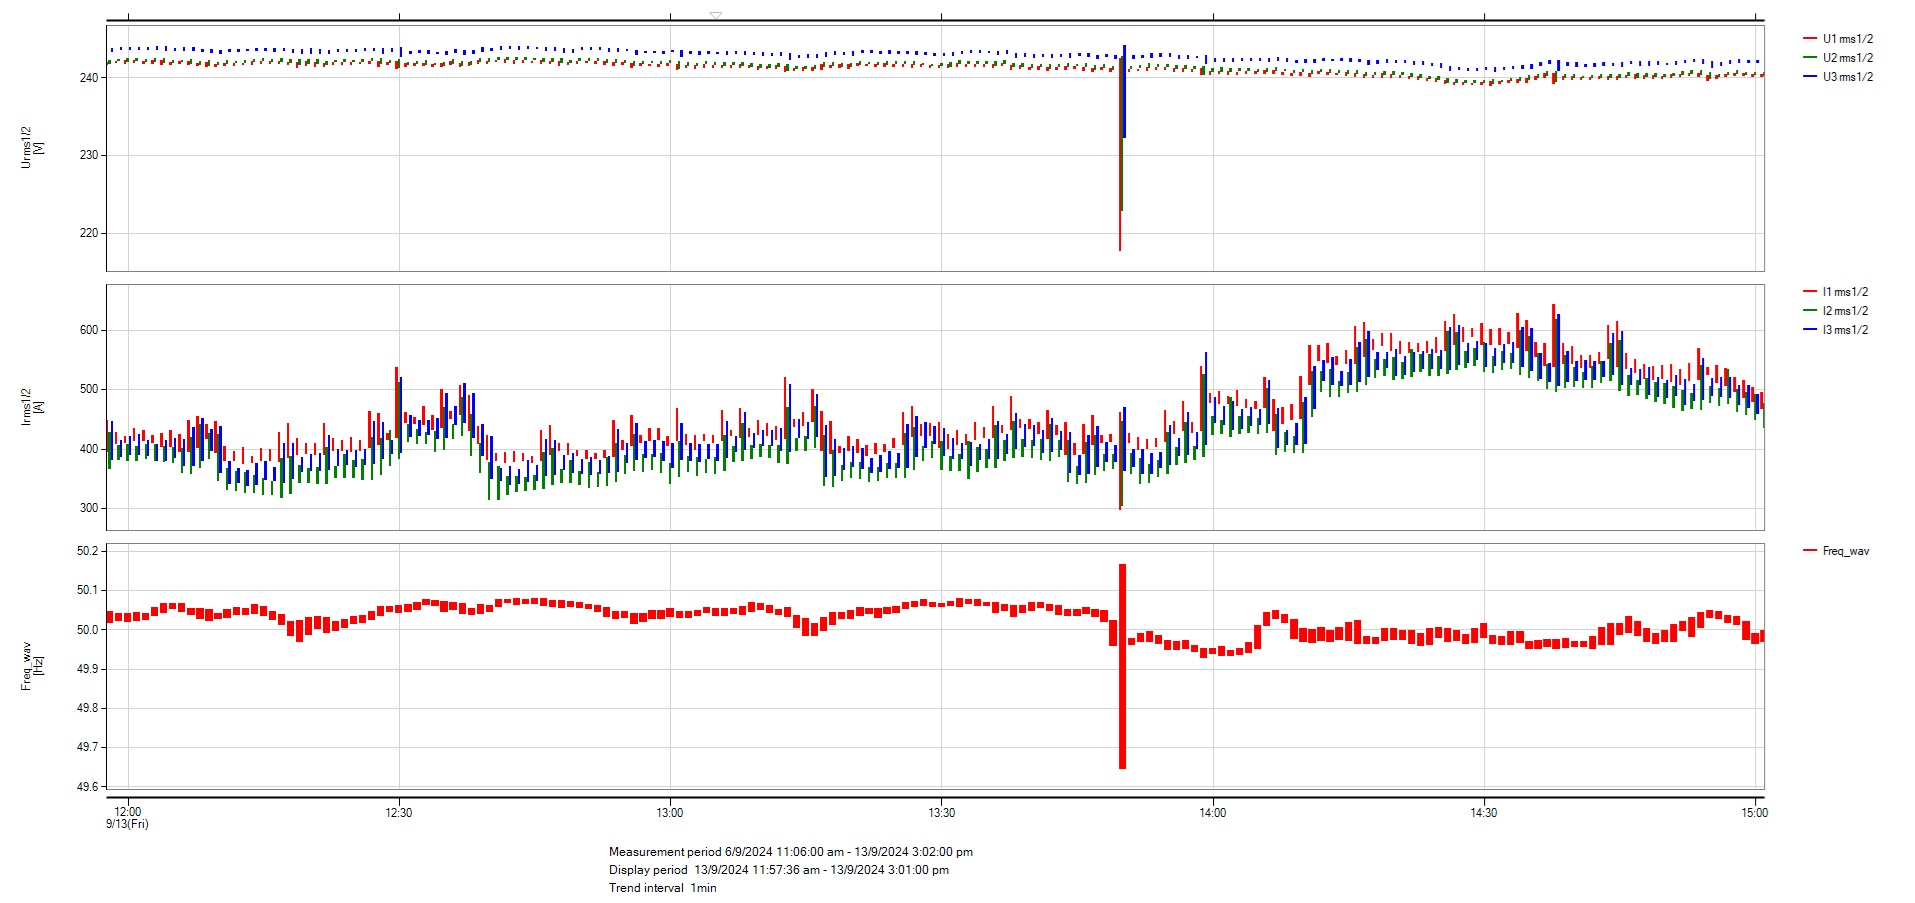
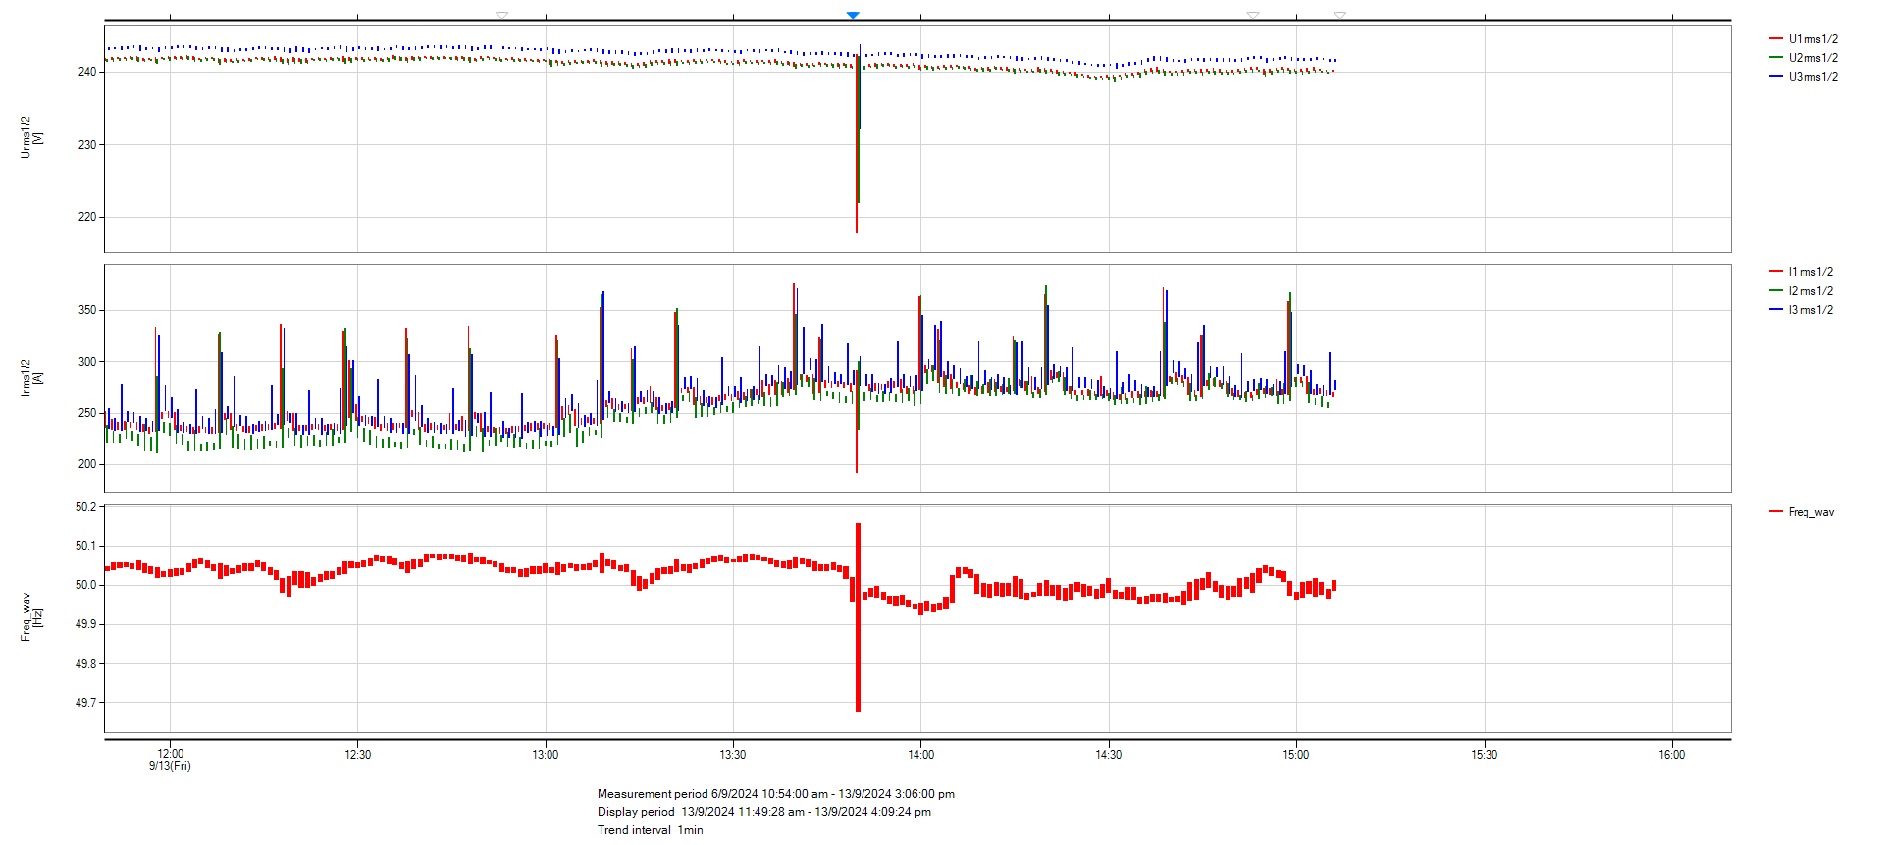
Earlier this afternoon, our portable PQ analyzers (monitoring at Low Voltage) at two different main incomers (in Loyang/Changi) saw a significant drop in voltages.
Technically, not a voltage dip here as the drop was less than 10% of the nominal 230V.
Apparently other parts of Singapore also experienced some form of voltage disturbance (dip or variation), depending on their locations (including my home – which is about 40km away from Loyang/Changi). Thus, confirming this was a transmission level related event.
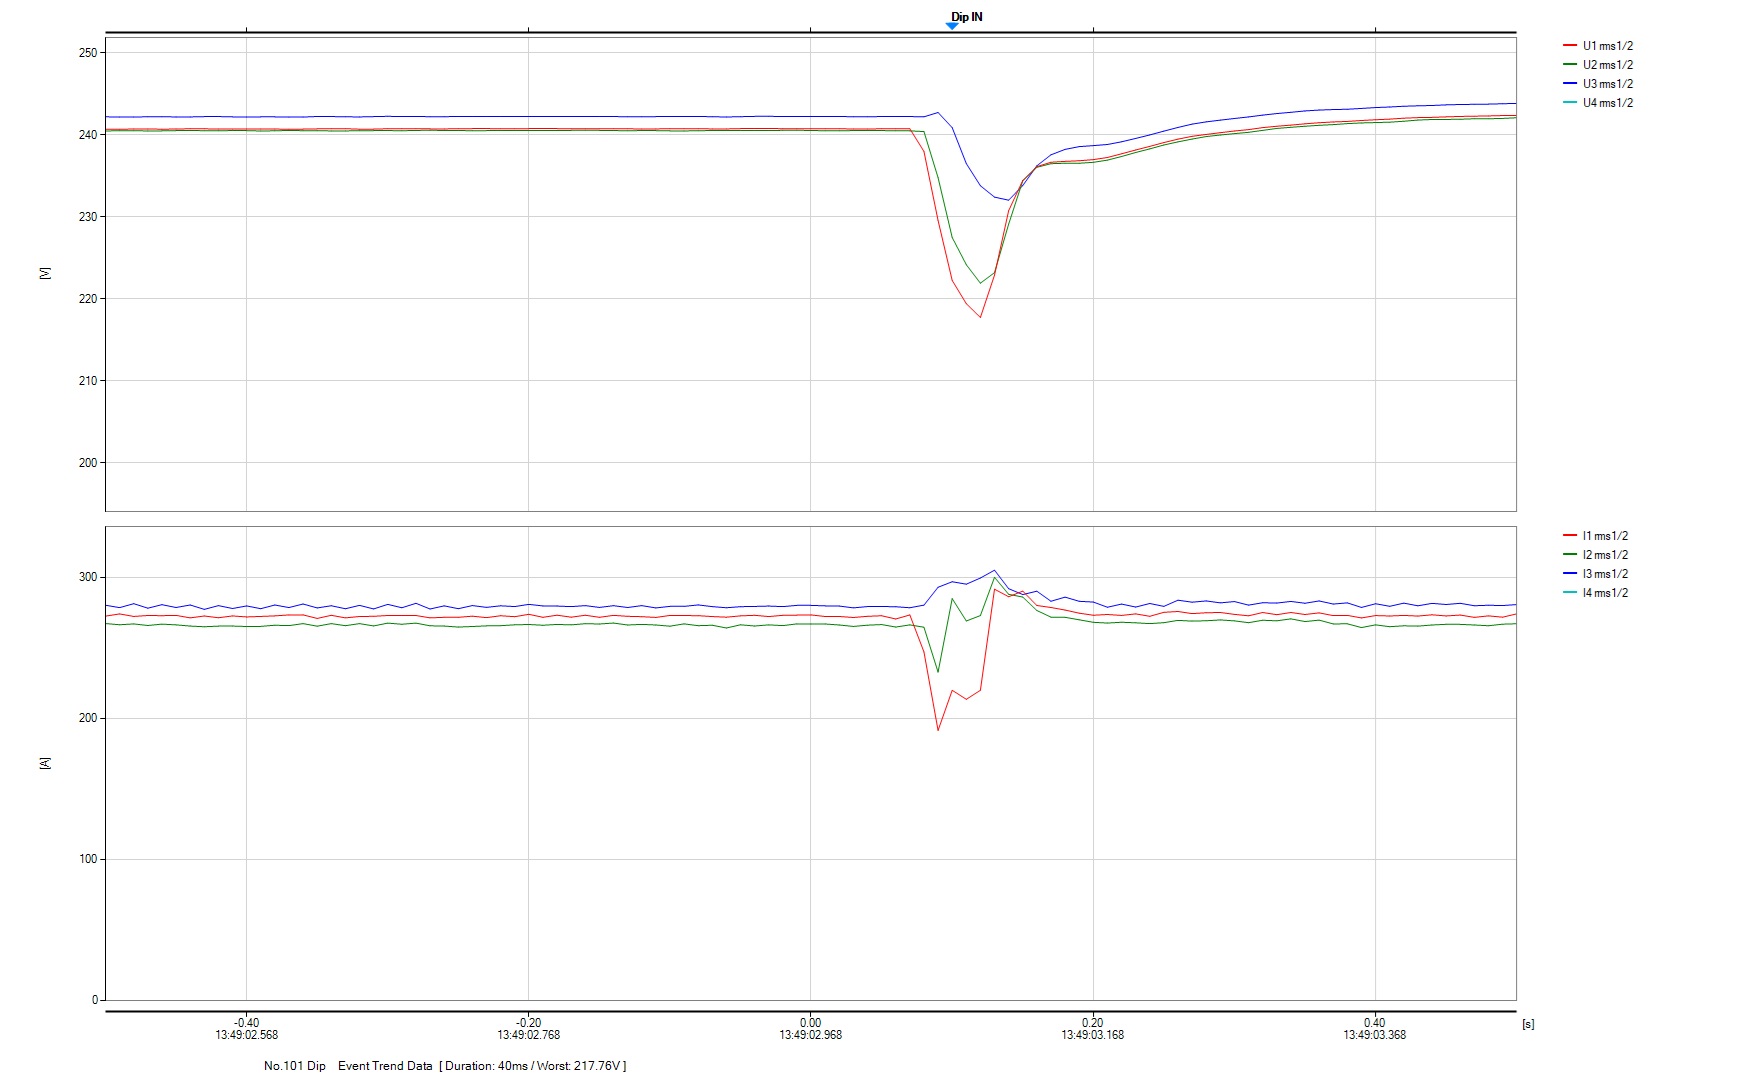
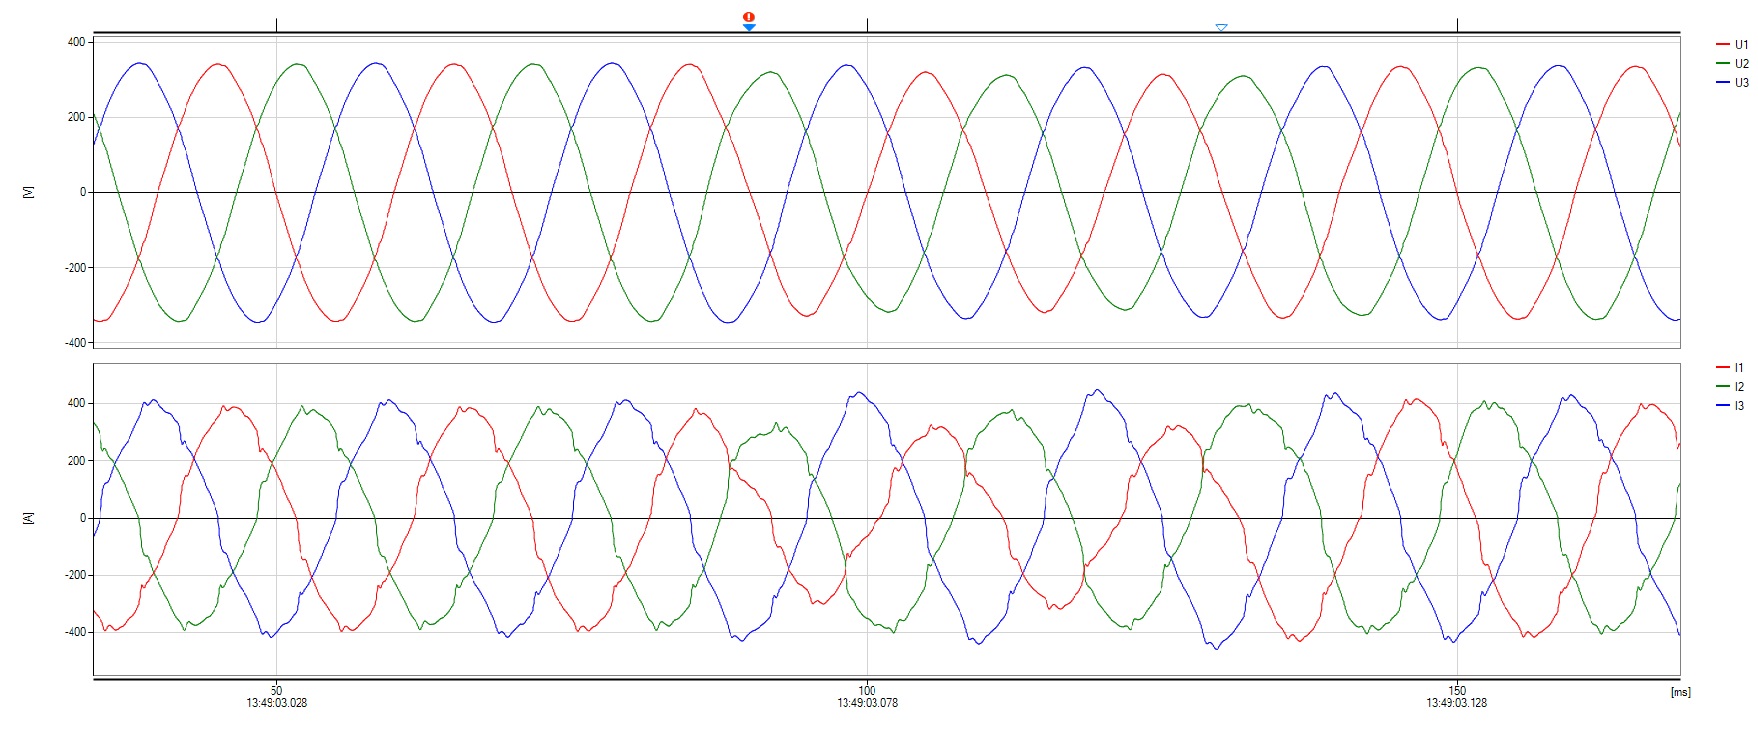
Update: Due to a 230kV cable fault (single-phase fault on Phase L2) in Jurong Island.
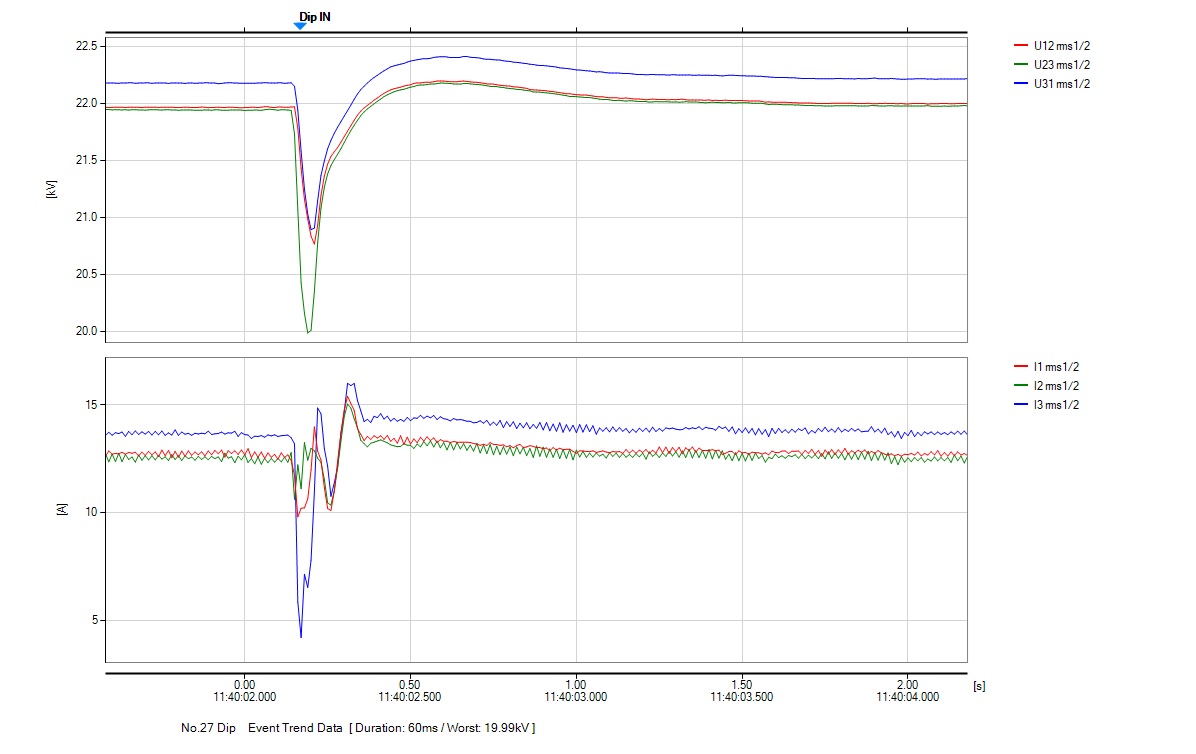
Here are just some trends and a waveform of the event that was captured by our portable PQ analyzers.
At LV PG Incomer 1At LV PG Incomer 2
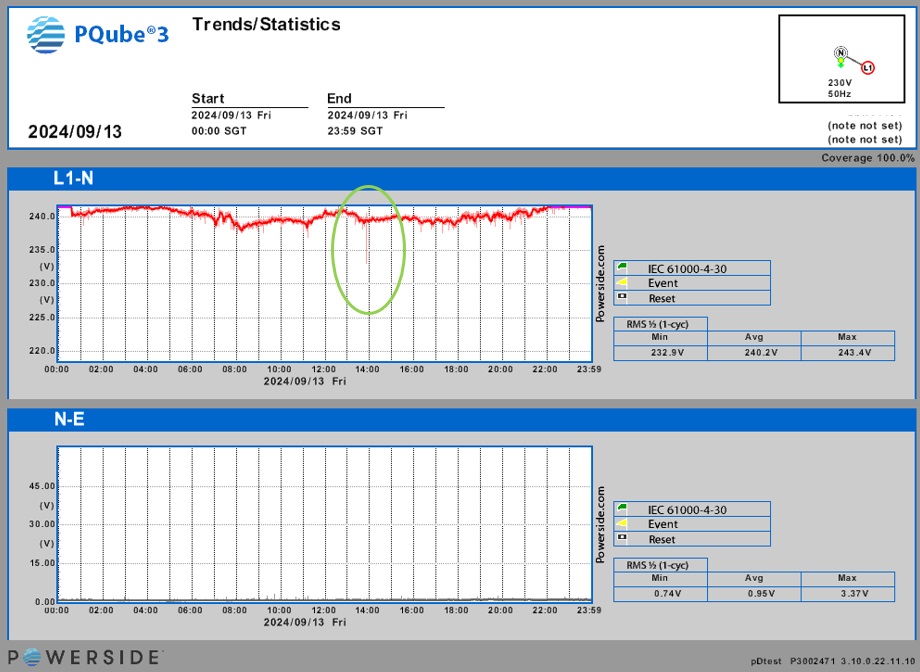
And the voltage trend from my home’s PQUBE3,
Updated 20/9/2024:
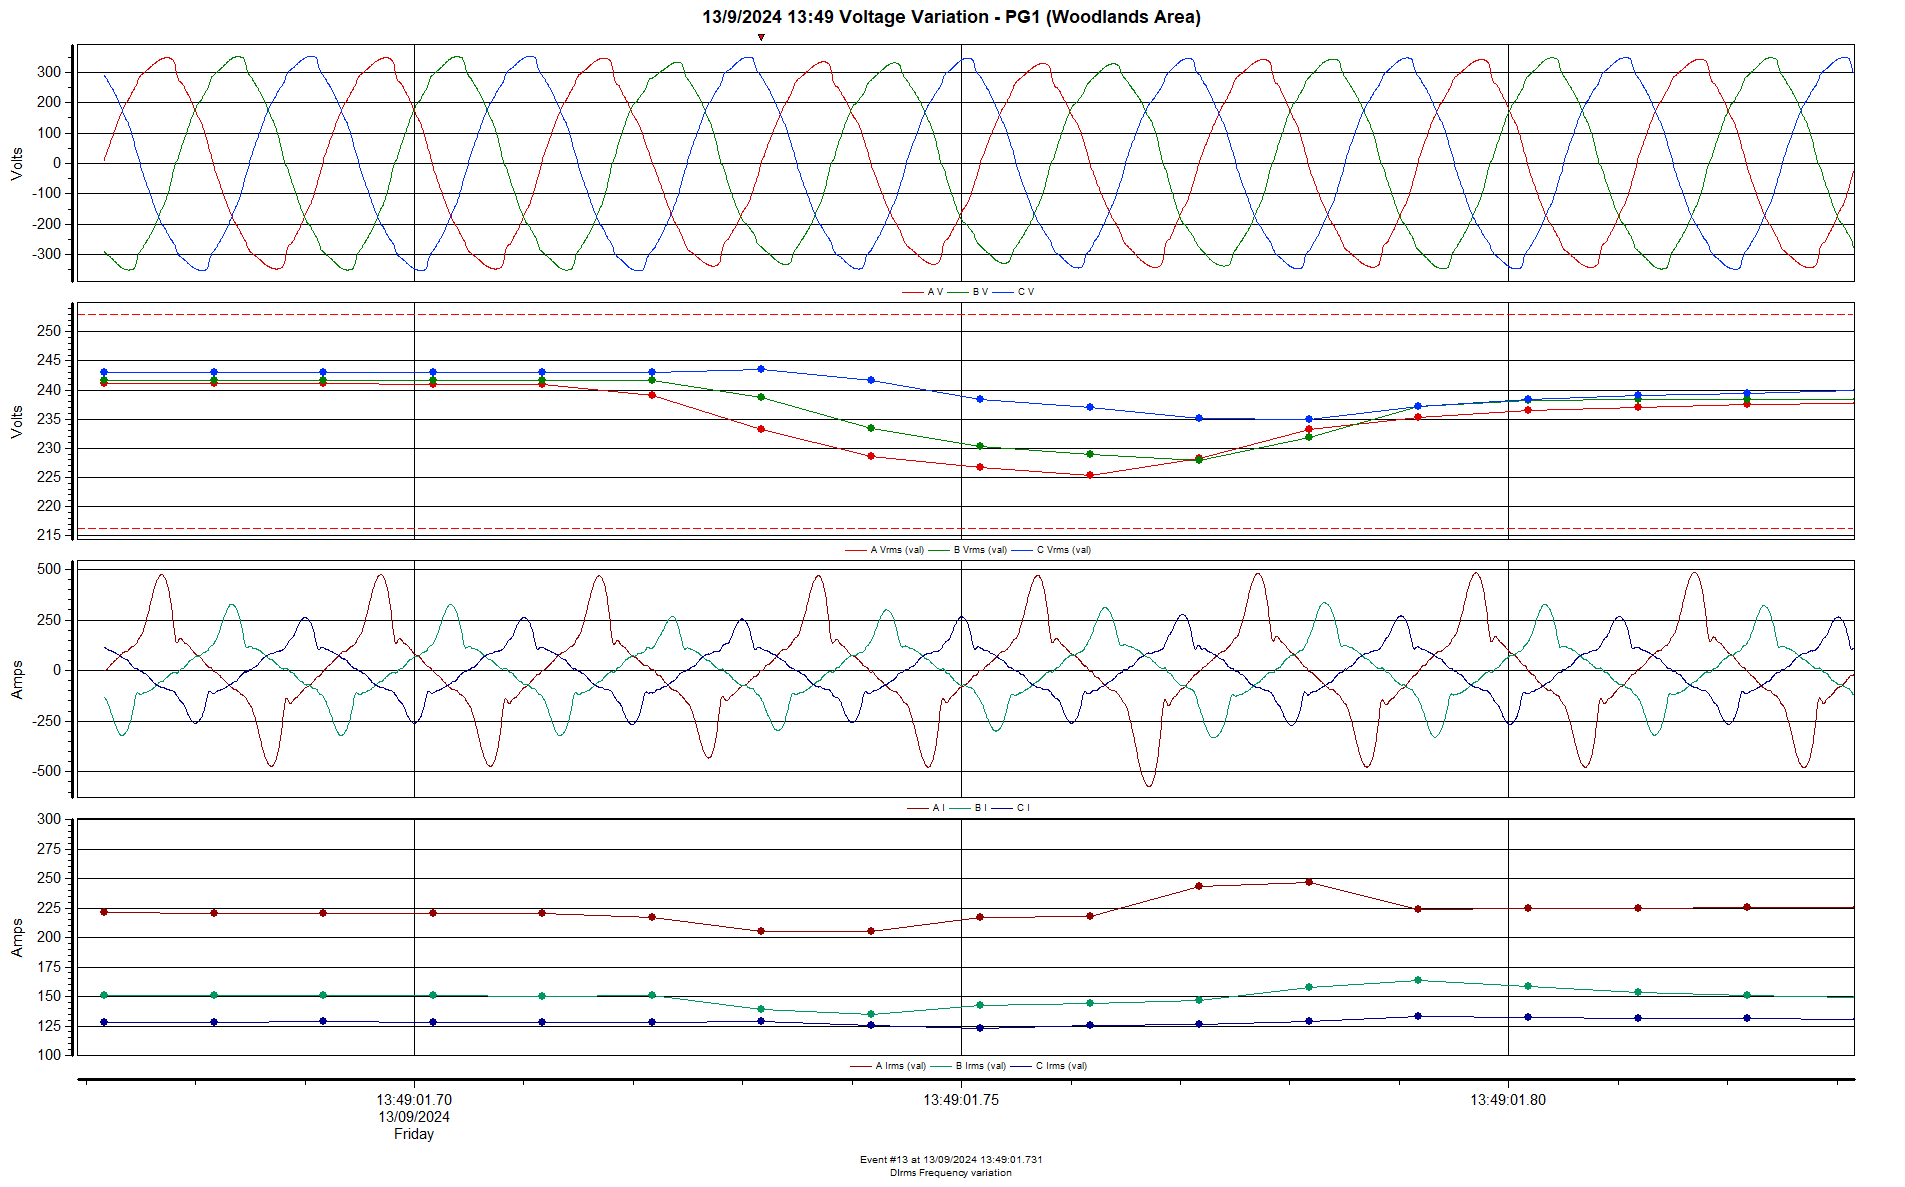
From another portable PQ analyzer that was monitoring in the northern area of Singapore.
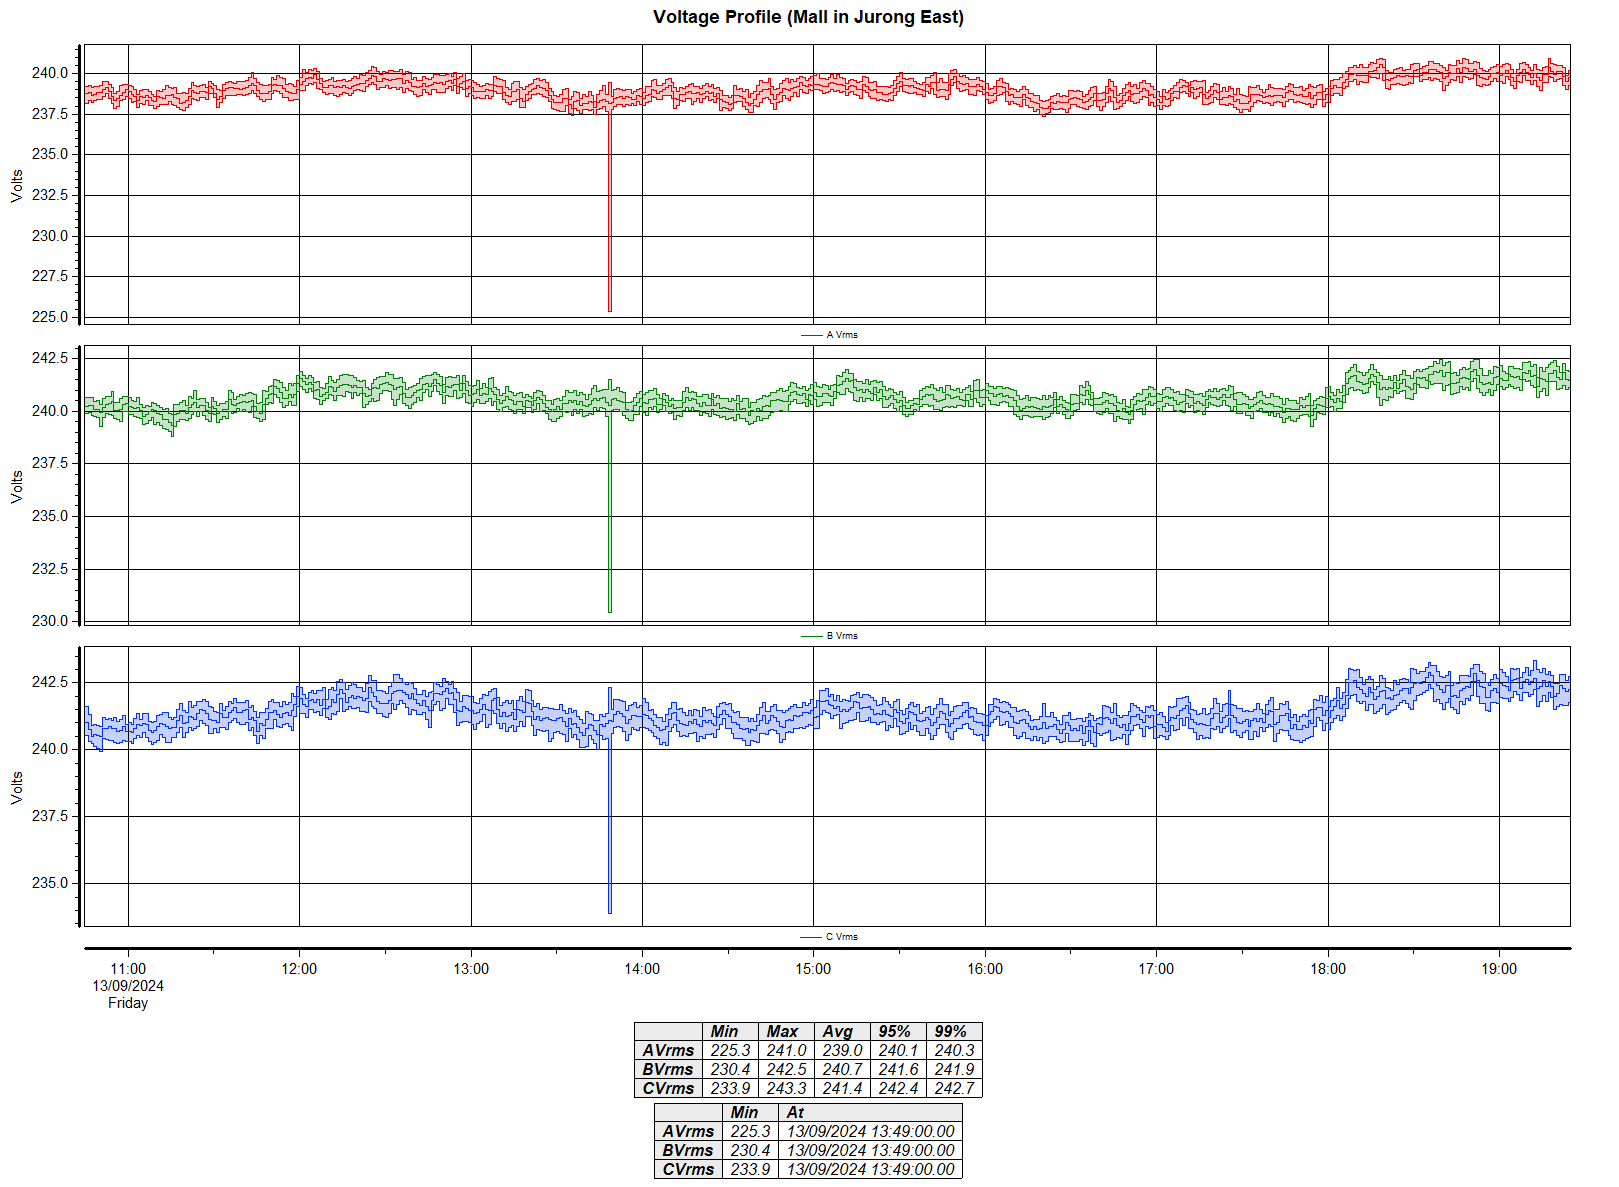
From another portable power logger that was monitoring in the western area of Singapore
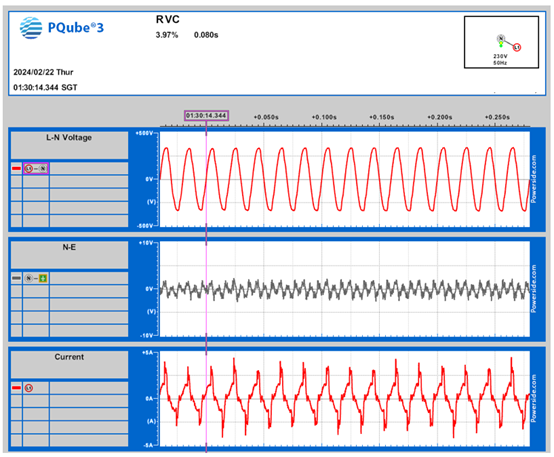
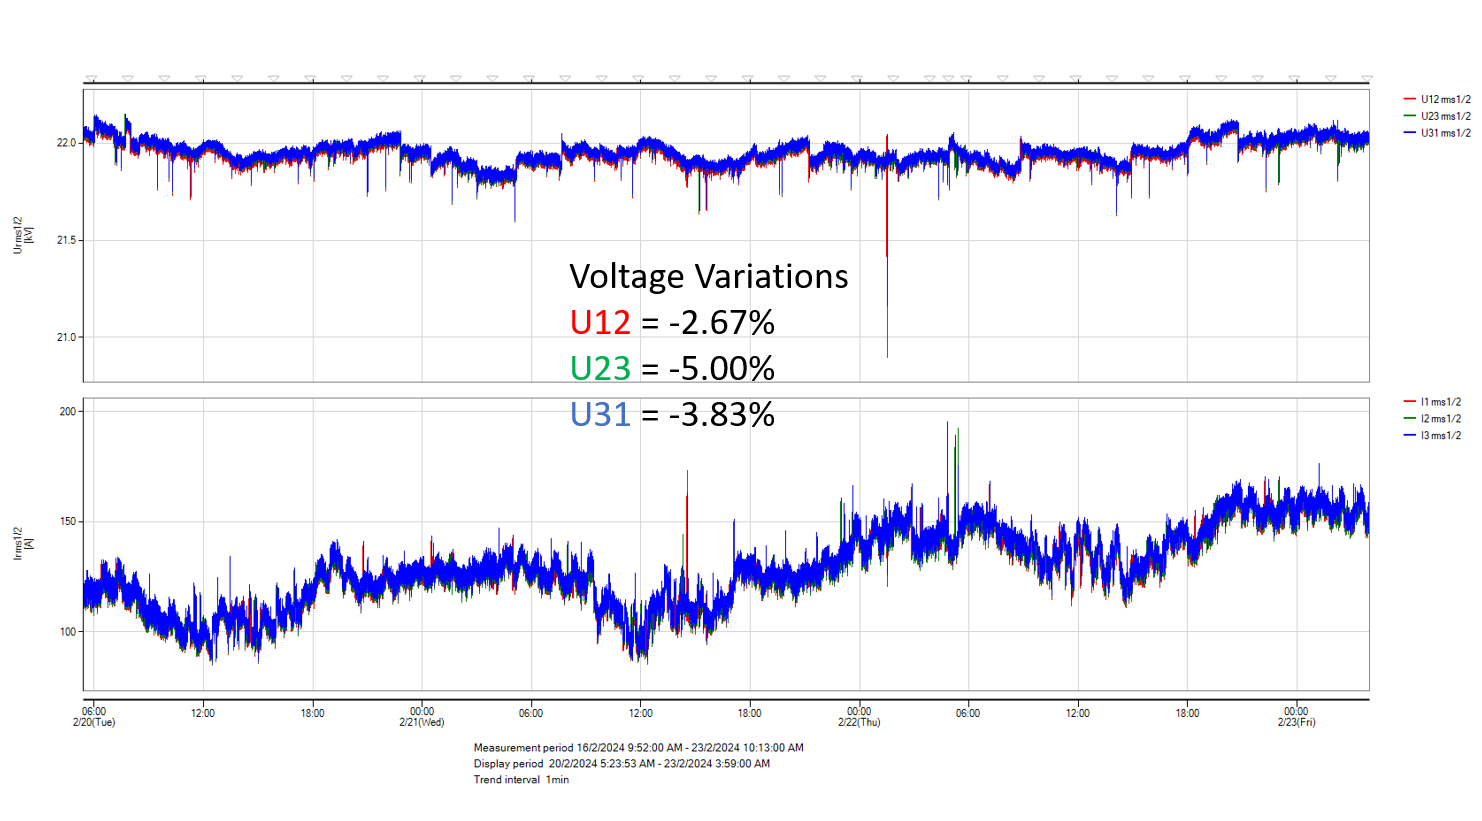
The PQUBE3 installed at my home’s incoming supply (230V Phase L3) detected an RVC (rapid voltage change) of 3.97% during the early morning of Thursday 22/02/2024.
And today, while retrieving a portable PQ monitor from one of our worksites in Banyan Drive, I noticed the following voltage trends (occurred at about the same time as my PQUBE3 event). This was recorded at 22kV.
For these 2 locations (one on the mainland in the western part of Singapore, and another on Jurong Island), to have similar voltage variations suggest that a transmission level fault had occurred during the said date/time.
We have two other sets of portable PQ monitors, one in Loyang (east of Singapore) and another in Marsiling (north of Singapore) which will be due for data retrieval next week. These PQ monitors would have similar stories to tell.
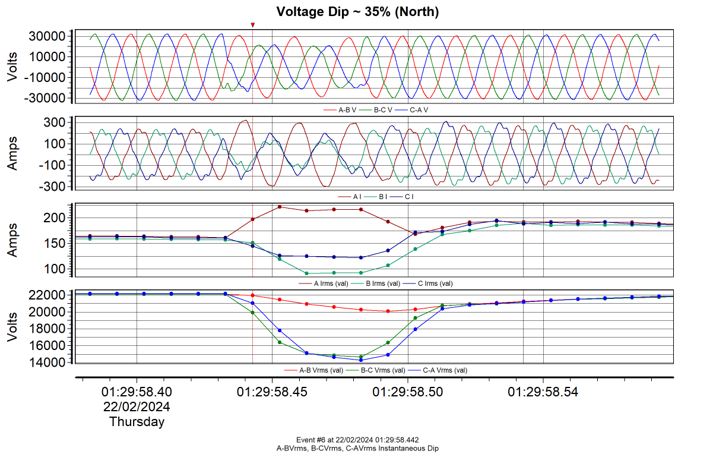
Updated – 28/2/2024
As expected, the other two set of portable PQ monitors captured the same event (at 22kV), with the PQ monitor at the northern part of Singapore saw the worst dip values, which was expected as the fault was made known to have originated from our northern neighbour (TNB – Malaysia).
Here, it can be deduced that it was a single-phase fault on the Blue phase (Phase L3).
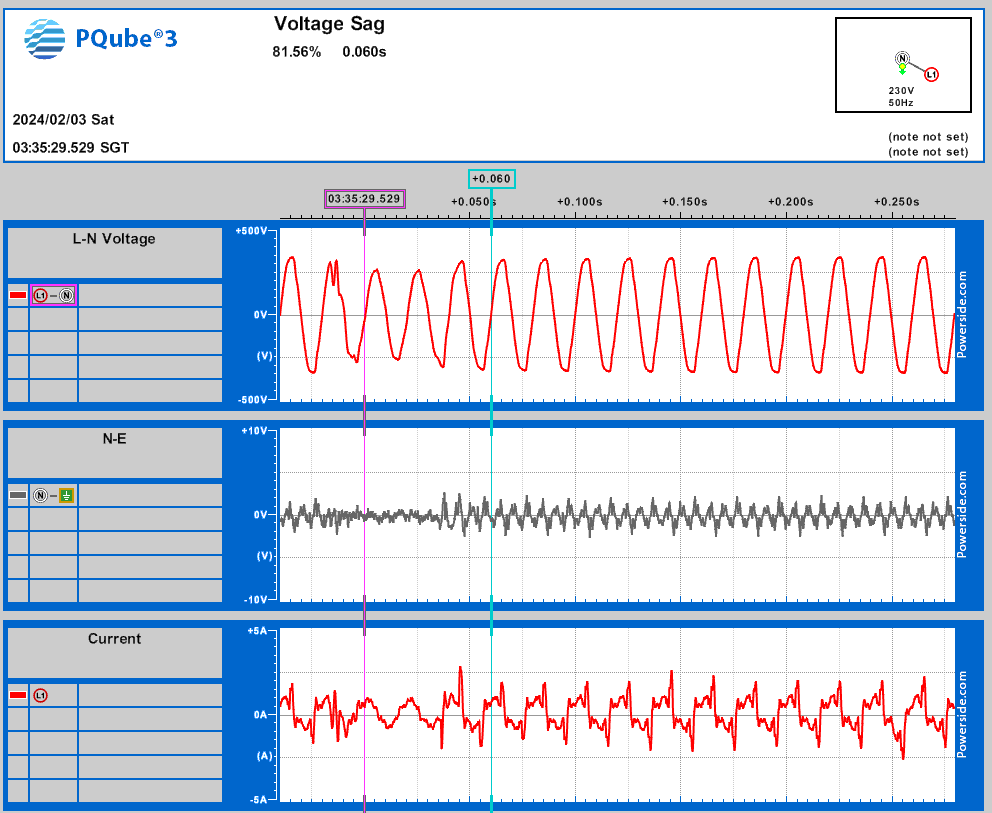
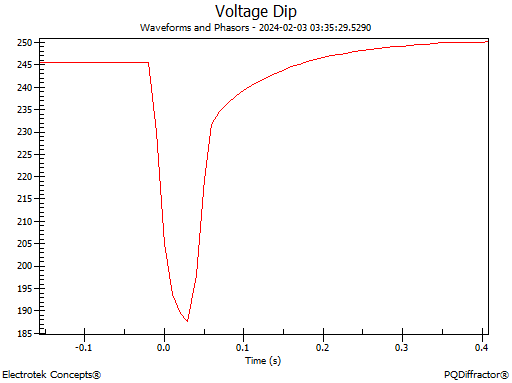
I had a PQUBE3 installed at my home’s incoming supply for about six months now and this was the first voltage dip (or sag) that it captured.
Apparently there was a transmission level cable fault in the Utility’s network. This would mean everyone in Singapore would have ‘seen’ it one way or another (in varying degrees, depending on locations).
My home (western part of Singapore) is taking in 230V single-phase supply (on Phase L3).
The PQUBE3 recorded a voltage dip of 18.44%, for a duration of 60ms (Lowest voltage was 187.6V).
Last week, two of our portable PQ analyzers captured a voltage dip of about 13% (at 22kV) lasting almost 200ms. It was made known later that it was due to a fault in the Tuas South area.
Our PQ analyzers were in the Tuas West Drive area.
Based on experience, for a voltage dip of about 10 to 20% to be seen in another 22kV network, it will need to be a significant fault causing a voltage dip in the range of 80 – 90% in the fault area (Tuas South).
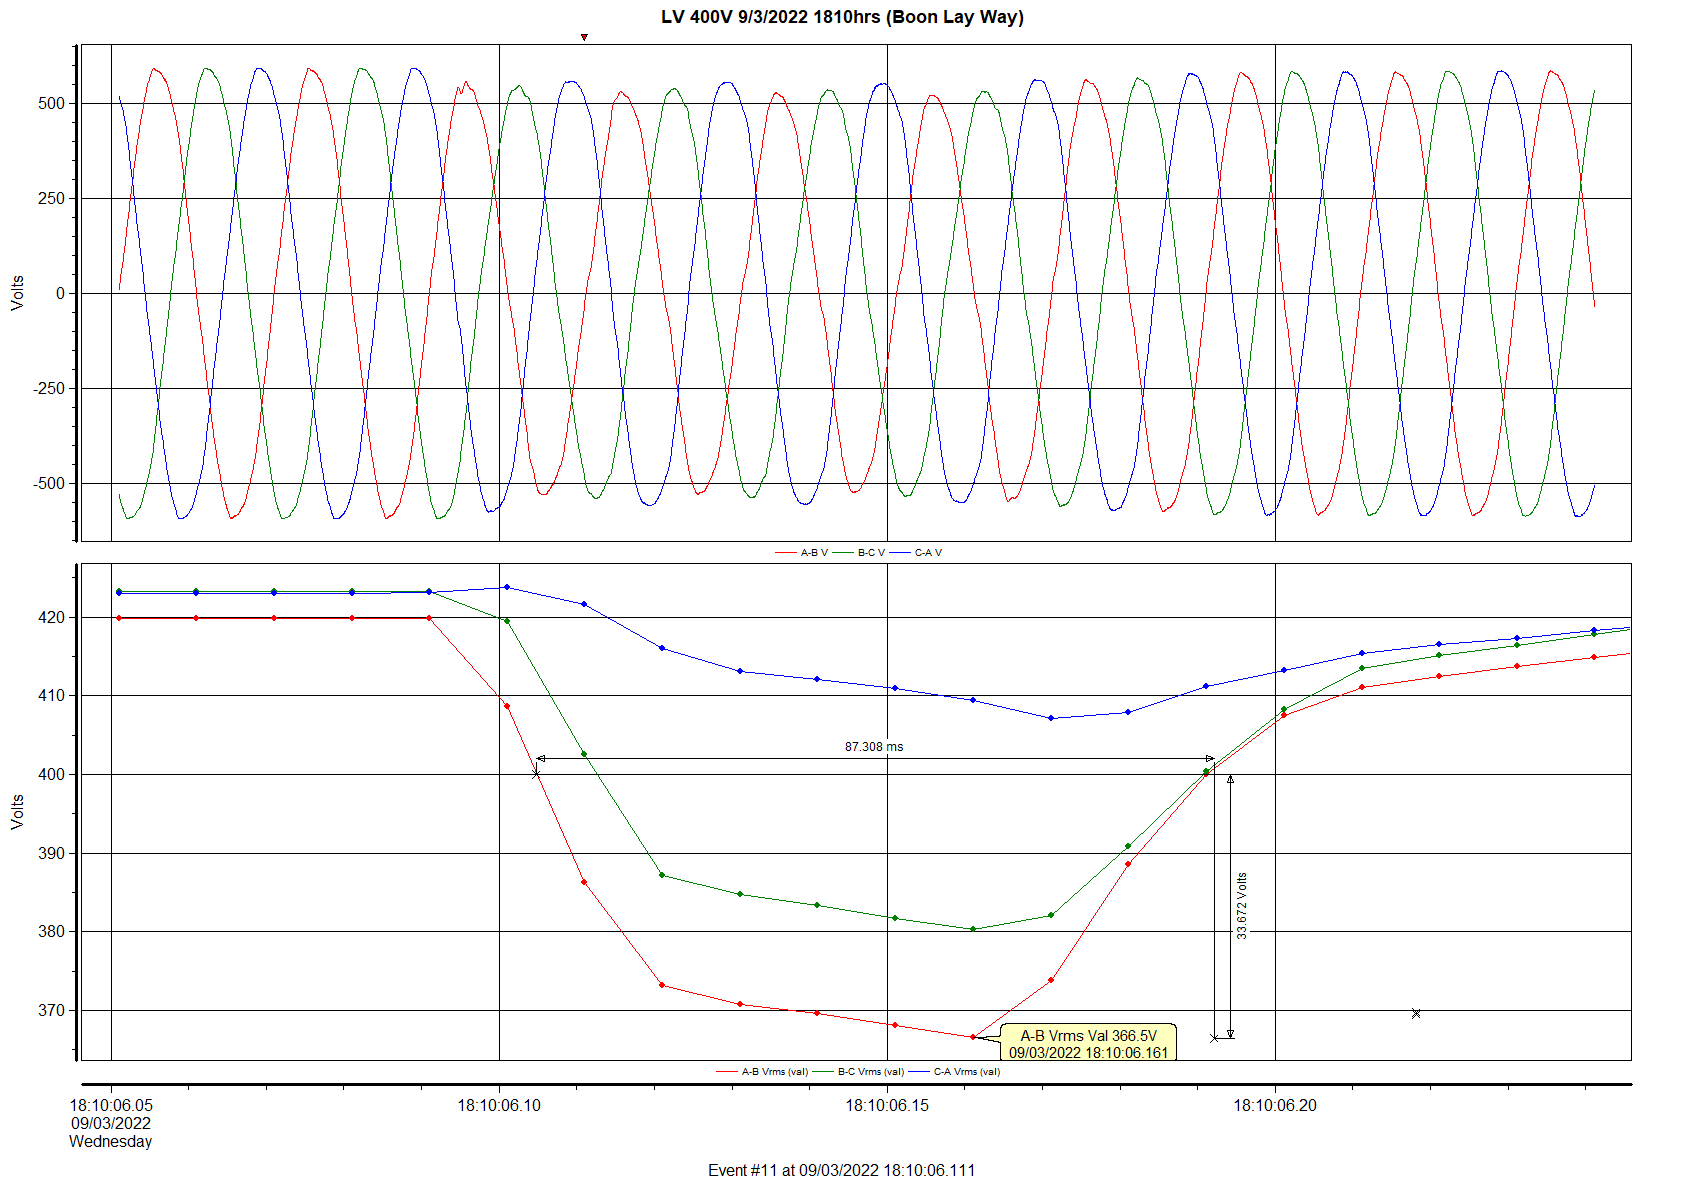
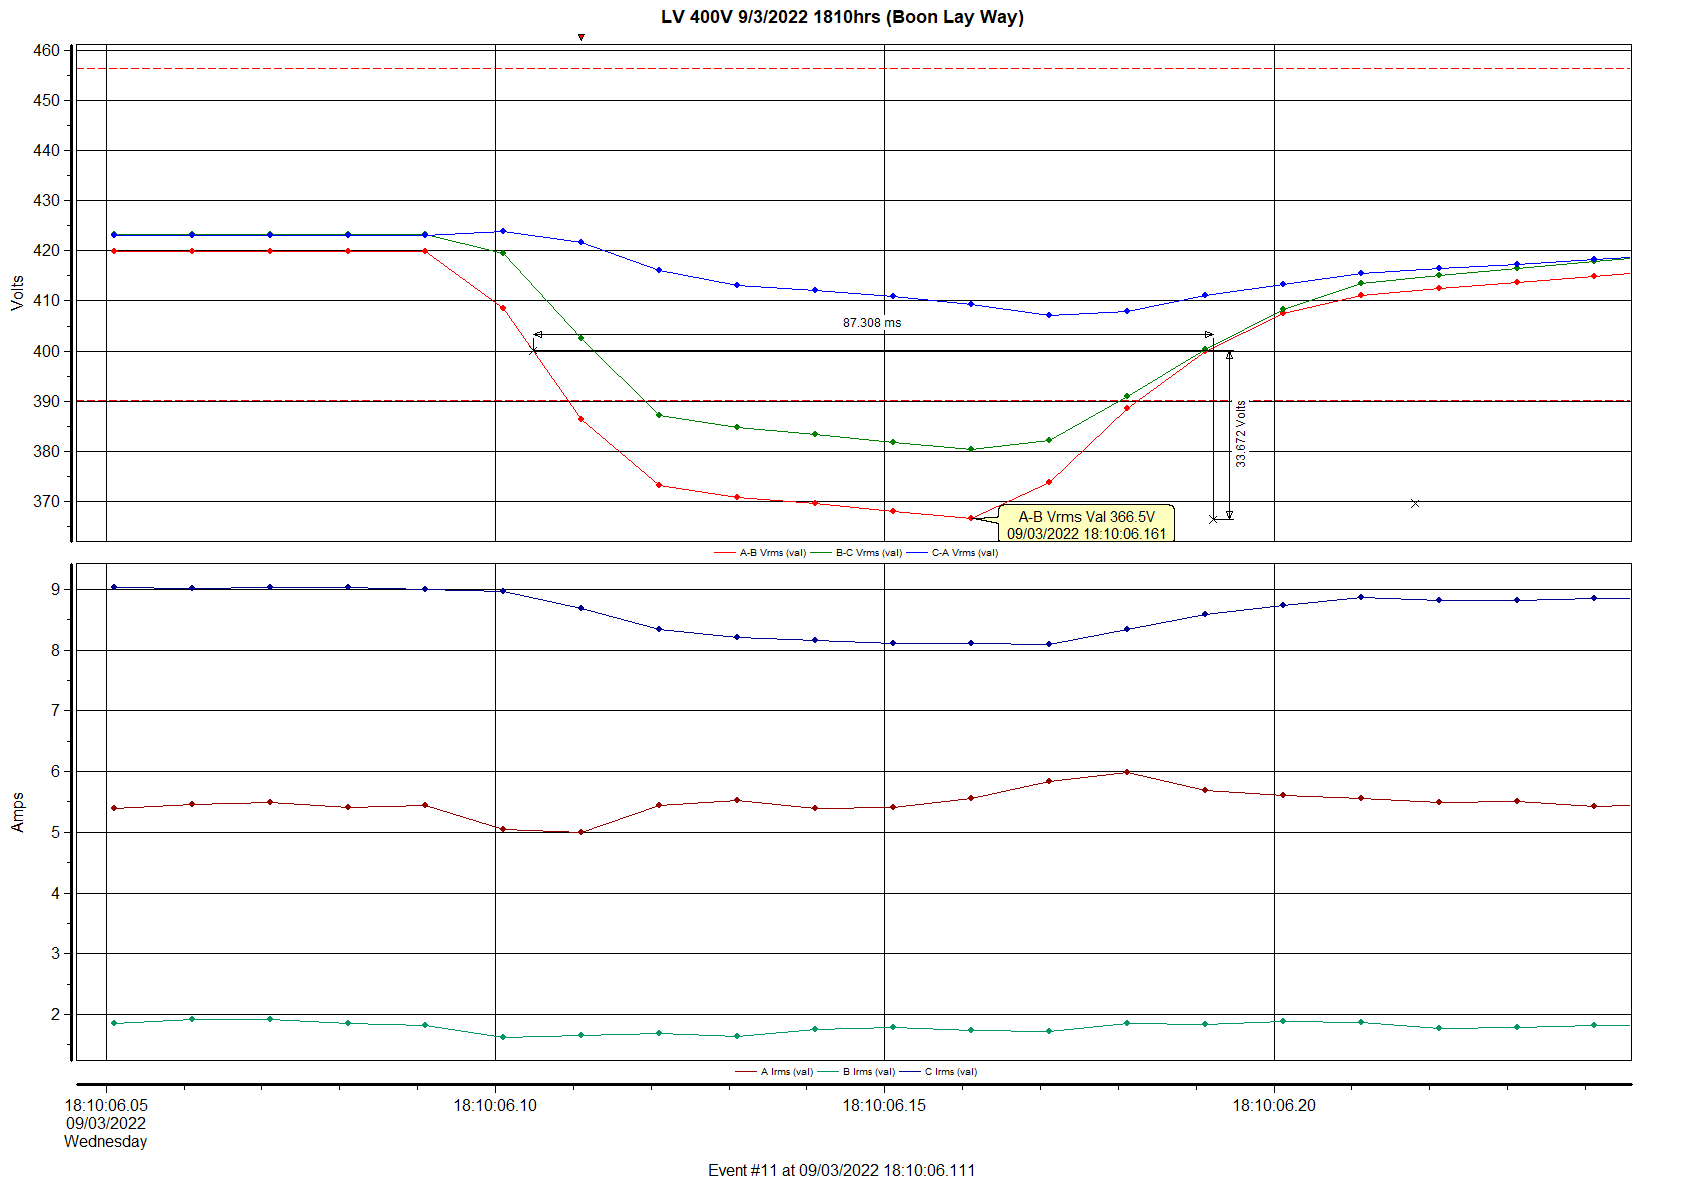
A voltage dip was reported in the Jurong-Pioneer area at around 6:10PM, due to a 22kV cable fault.
Our office, a 15-20mins drive away (Jurong East – Boon Lay Way) recorded a drop in voltages of about 13% (from 420V to 366.5V) or about 8% (if referred to nominal voltage of 400V), as seen below.
Measured at 400V (Line to Line)
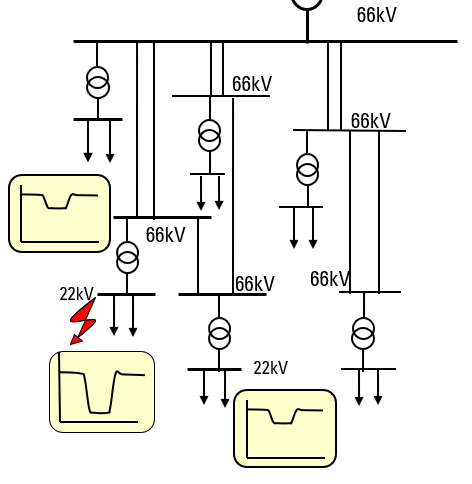
One may wonder how could a fault in Pioneer area affects the voltages in Jurong East?
Our local distribution grid is densely interconnected, resulting in a high-reliability electricity network. Total blackouts are rare. But interconnectivity brings about a small disadvantage. Any fault will be seen/felt (in the form of a voltage dip) by everyone who is connected. The seriousness of this dip will be dependent on the types of faults and the electrical distance between you and the fault point.
Based on past experiences, for a voltage disturbance of about -10% to be seen at another 22kV network, it will need to be a significant fault causing a voltage dip in the range of 70-80% in the fault area.
Our office is in another 22kV network, which is connected to the fault area via the 66kV network path, as illustrated below.
Such drop in voltages usually do not cause much problem(s) to the equipment-end (especially typical office loads), as observed in the following Irms trends during this voltage disturbance.
What happens if a voltage dip occurred, and for some reason(s), you had not set the PQ analyzer to capture it or that the PQ analyzer had ran out of memory for capturing of events? (Note: some brands of PQ analyzer do have a limitation on how much event(s) it can record).
The short answer is that you will not be able to get detailed waveforms (and trend) of that particular event. Hence, information such as how long was the dip would not be known.
But not to worry. Not all is lost. You will still be able to get the lowest (minimum) RMS voltage(s) recorded. Depending on the brand/model/software used, one will need to plot out the ‘per-cycle’ RMS voltage minimum trends.
Dranetz, for instance has incorporated these per-cycle trends automatically in their voltage/current trends. So the minimum/maximum value(s) that one see on a Drantez voltage/current RMS trend is really the lowest and highest value(s) recorded.
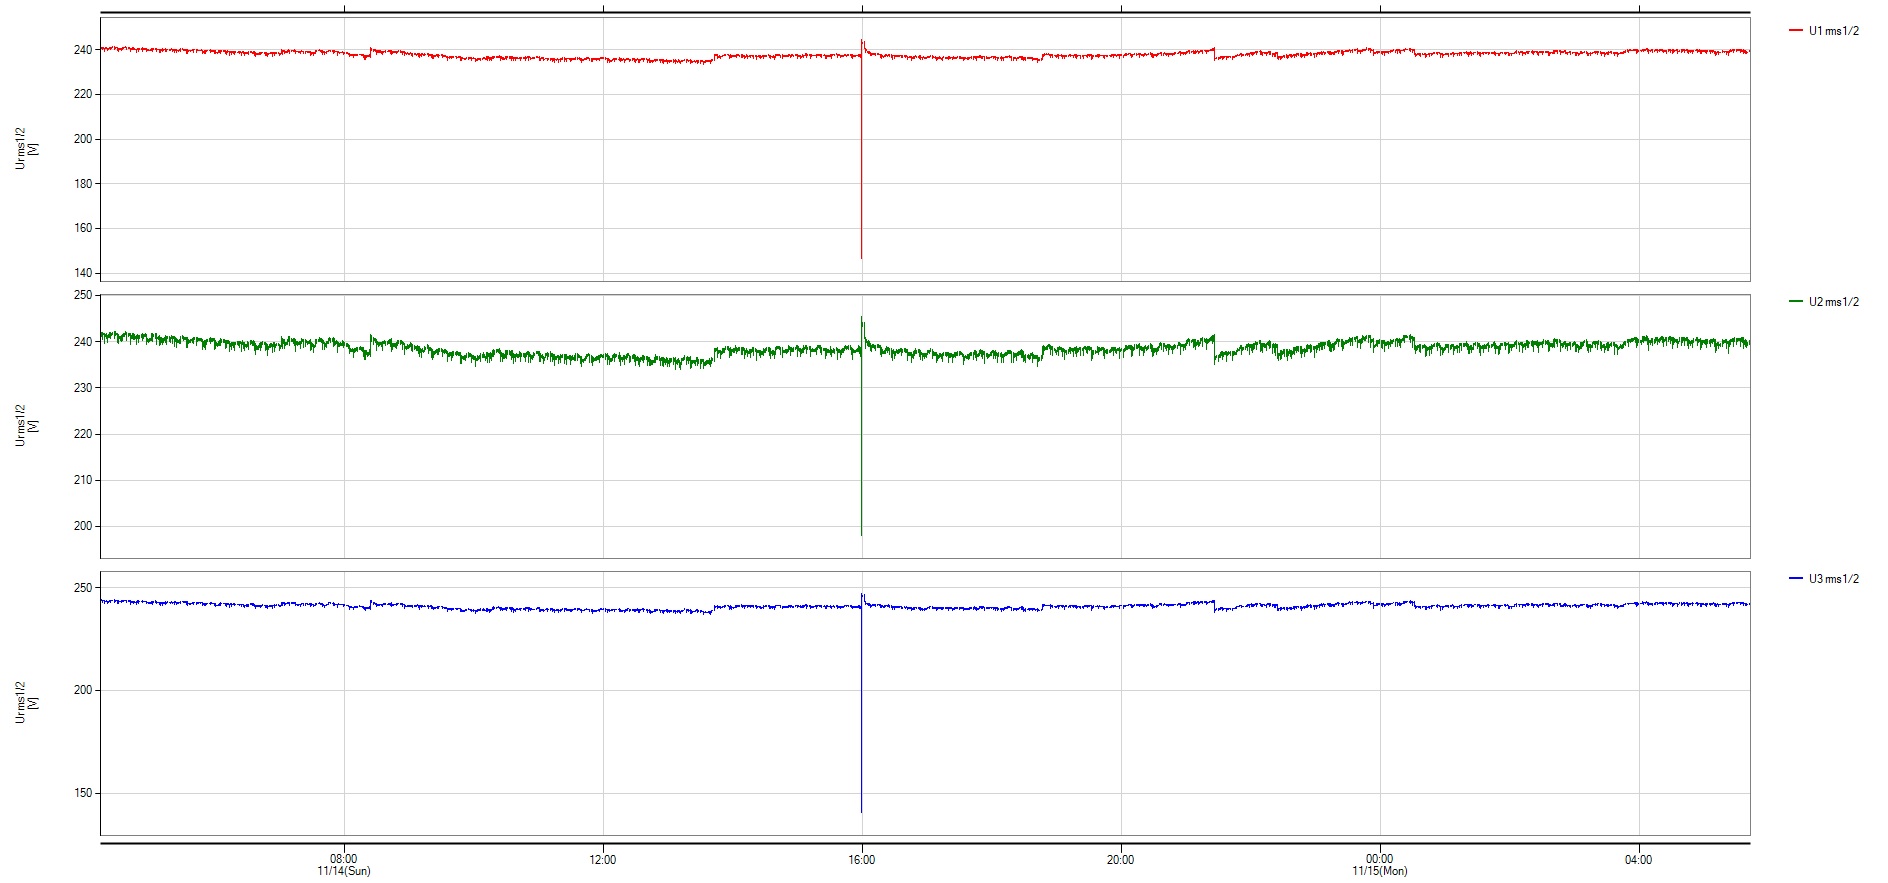
For others, you need to find things like “Detailed RMS trends”. Typically they termed this as the Vrms 1/2 trends, as seen here.
Vrms 1/2 Trend – Showing The Voltage Dip That Occurred on 14/11/2021 1600hrs (V1: 146V, V2: 198V, V3: 140V)
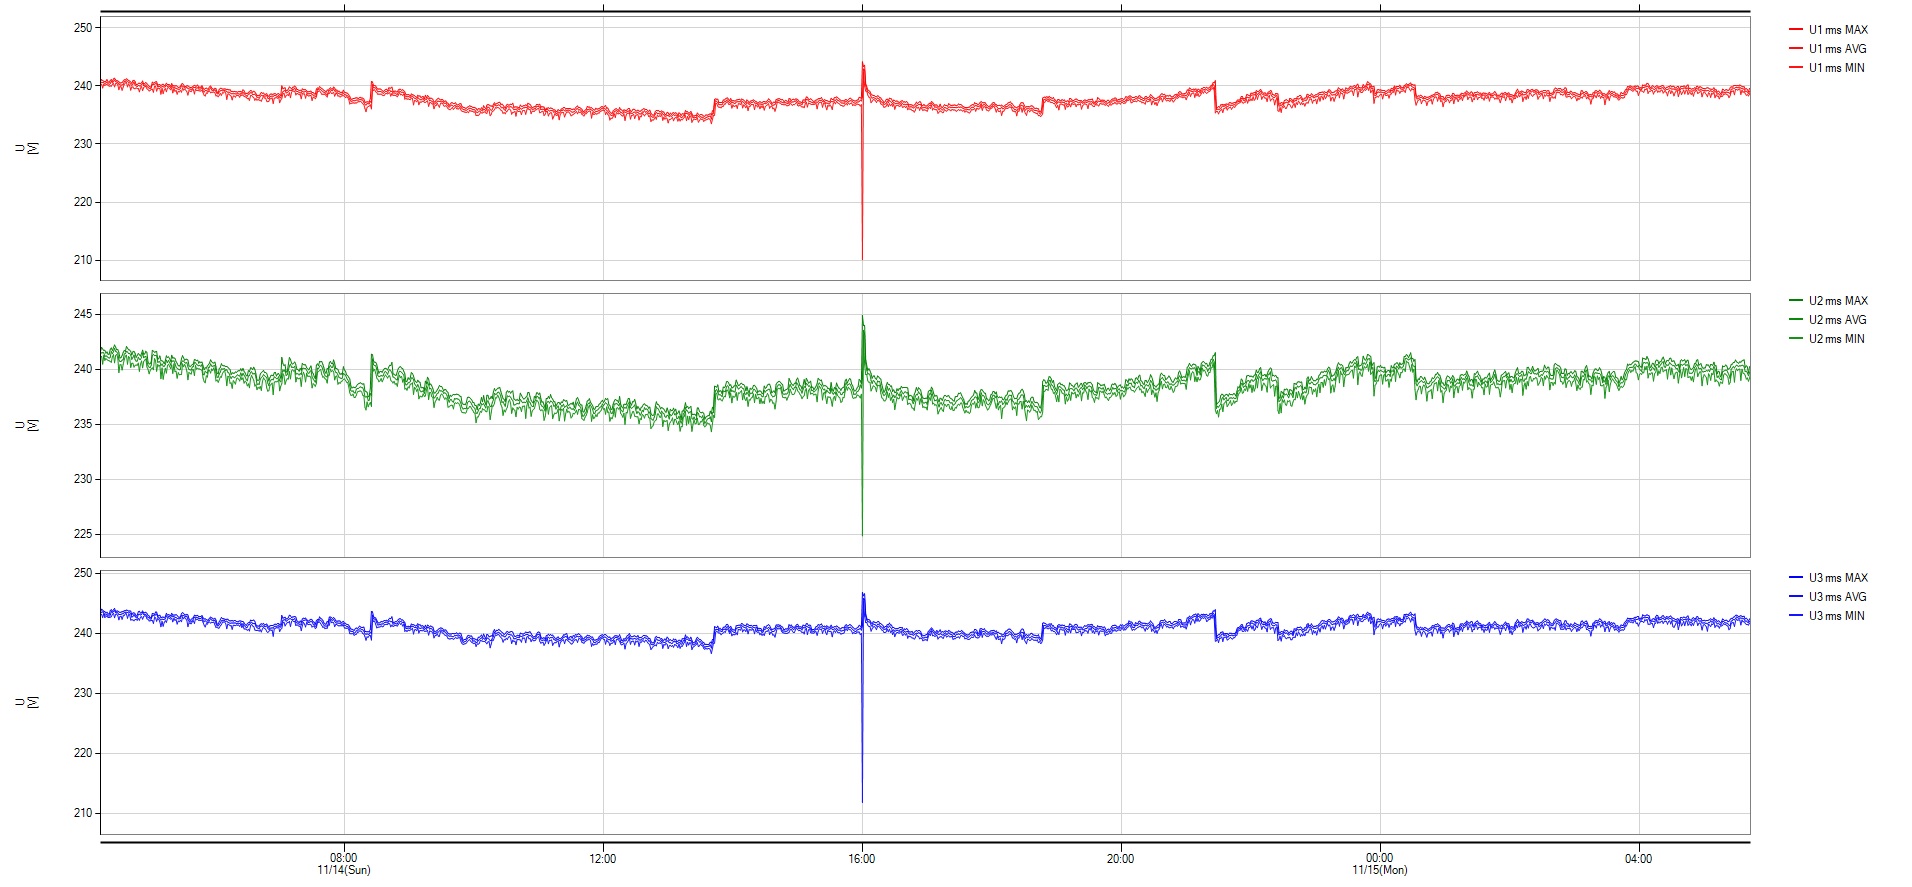
One must be careful not to plot the ‘normal’ RMS trends, which calculate out the RMS values based on sets of 10-cycle waveforms, as shown below. Values here will not show the true worst-case min/max values. Short events like a voltage dip which lasts 3-4 cycles, will get ‘diluted out’ here in a 10-cycle RMS calculation.
Vrms Trend – (V1: 210V. V2: 225V, V3: 212V) (also usually seen on standard power loggers)
What is seen on the second trend graph here is also what is usually obtained when one uses a standard power logger. Hence the difference (in capability) between a PQ analyzer and a power logger, is clearly illustrated here.
Trend Analysis
Without an event capture, it will be impossible to ascertain the actual duration of this voltage dip. However, based on the differences in the two trends (Vrms 1/2 vs Vrms) minimum values, we can tell that this dip was definitely less than 10 cycles ( < 200ms).
This monitoring was done at Low Voltage (monitored at 3P4W) in a commercial complex along Orchard Road, with V1 and V3 dropped significantly (dip by about 40%) and V2 slightly lesser (dip by about 17%). Comparing with its loading/current trend suggests this was an event upstream of the monitoring point.
Looking upstream at 22kV, dip magnitudes at 22kV will be similar (i.e 22kV dip magnitude V12 will be similar to LV V1). At 22kV, for a voltage dip of such characteristics, it was likely an event originating from a higher voltage level (you may refer to other voltage dip posts on this).
Feedback from other PQ monitors island-wide supports this. This was a transmission-level voltage dip event. The trend results suggest that it was a single-phase (L1) transmission level fault.
On October 13, 2000, the Public Utilities Board announced, “New Measures to Control Voltage Dips”, which went effective on 1 November 2000.
The new measures include reviewing a licensed electrical engineer (LEE)’s performance if the electrical installation(s) under his charge had caused a total of 3 voltage dips, within a period of 2 years.
This was the beginning of having all voltage dip incidents (date, site, LEE-in-charge) published on the Authority’s website.
From The National Archives Singapore
Then, the utility’s (PowerGrid) power quality section, the Power Quality and Load Analysis (PQLA) section, was just being formed. The island-wide power quality monitoring system (PQMS) was still in the works. It became operational somewhere in 2001-2002 with 80+ PQ monitors monitoring voltage levels from 22kV to 230kV.
Singapore’s 230kV transmission network was just being split into two networks, effectively minimizing the impact of a 230kV voltage dip from one another.
Voltage dip, then and now is still a costly affair for sensitive industries. While just lasting in terms of milliseconds, it can have a detrimental impact on production processes, especially those in the semiconductor-related industries.
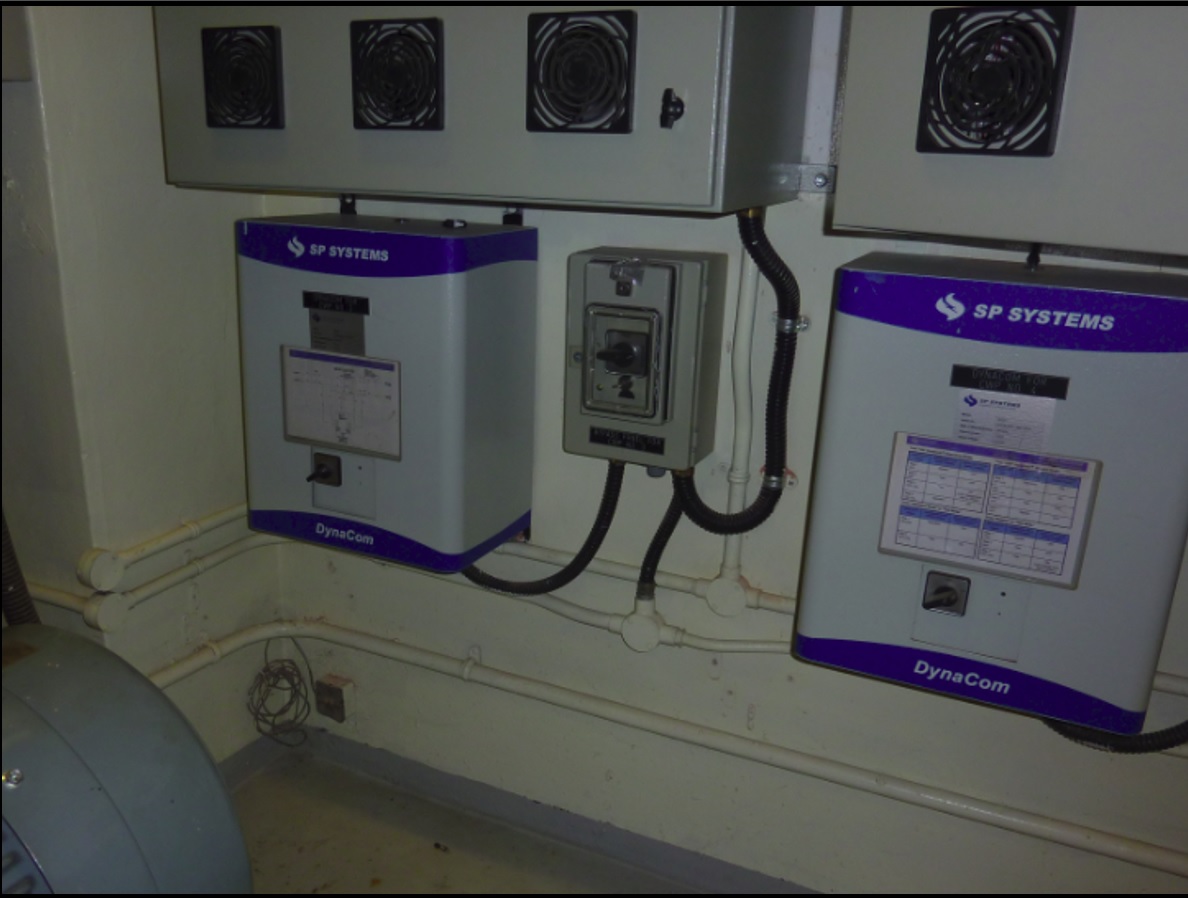
The utility via its subsidiary (SP Systems) introduced (shortly after in October 2002), a voltage dip mitigation device, known as the Dynacom. It was a single-phase ultra-capacitor-based device meant to compensate voltage dips as low as 40% of nominal and for up to 1 second. It was targeted at protecting sensitive control circuits.
SP Systems Dynacom
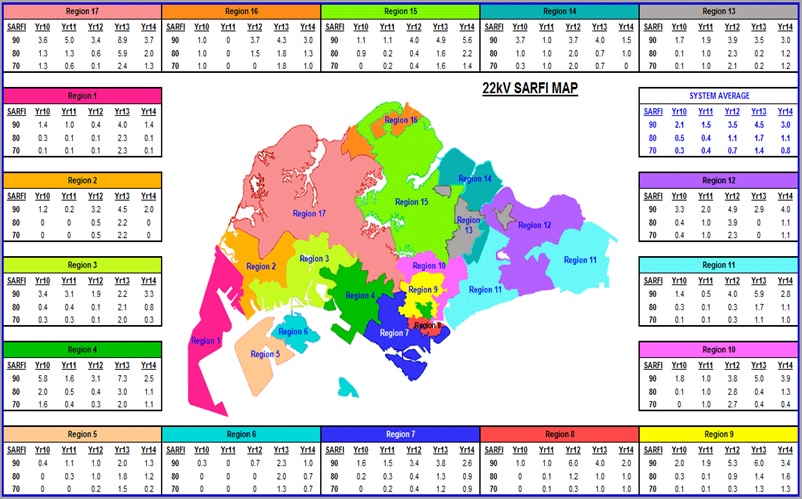
Fast track to today and the number of PQ monitors has more than doubled. The PQMS has enabled the utility to keep track and map out its voltage dip performance (System Average RMS Frequency Index – SARFI map) to the various regions of the island.
An Old SARFI map
Singapore’s 230kV transmission network has since being split into 4 parts, limiting the significant impact of a 230kV voltage dip to just 1/4 of the island.
With inter-connectivity to our ASEAN neighbours being the talk of the town these days to improve the reliability of the electricity grid, we must not forget it does come with some downside as well.
Being inter-connected, any fault that occurred in one country’s electrical network can be seen in another. For instance, right now, Singapore is connected to Malaysia at 230kV. Any faults on either side of the network will be seen by both.
Here, in a recent event whereby a Tenaga Nasional Berhad (TNB)’s transformer was reported to have tripped. It had caused a voltage variation here in the eastern part of Singapore.
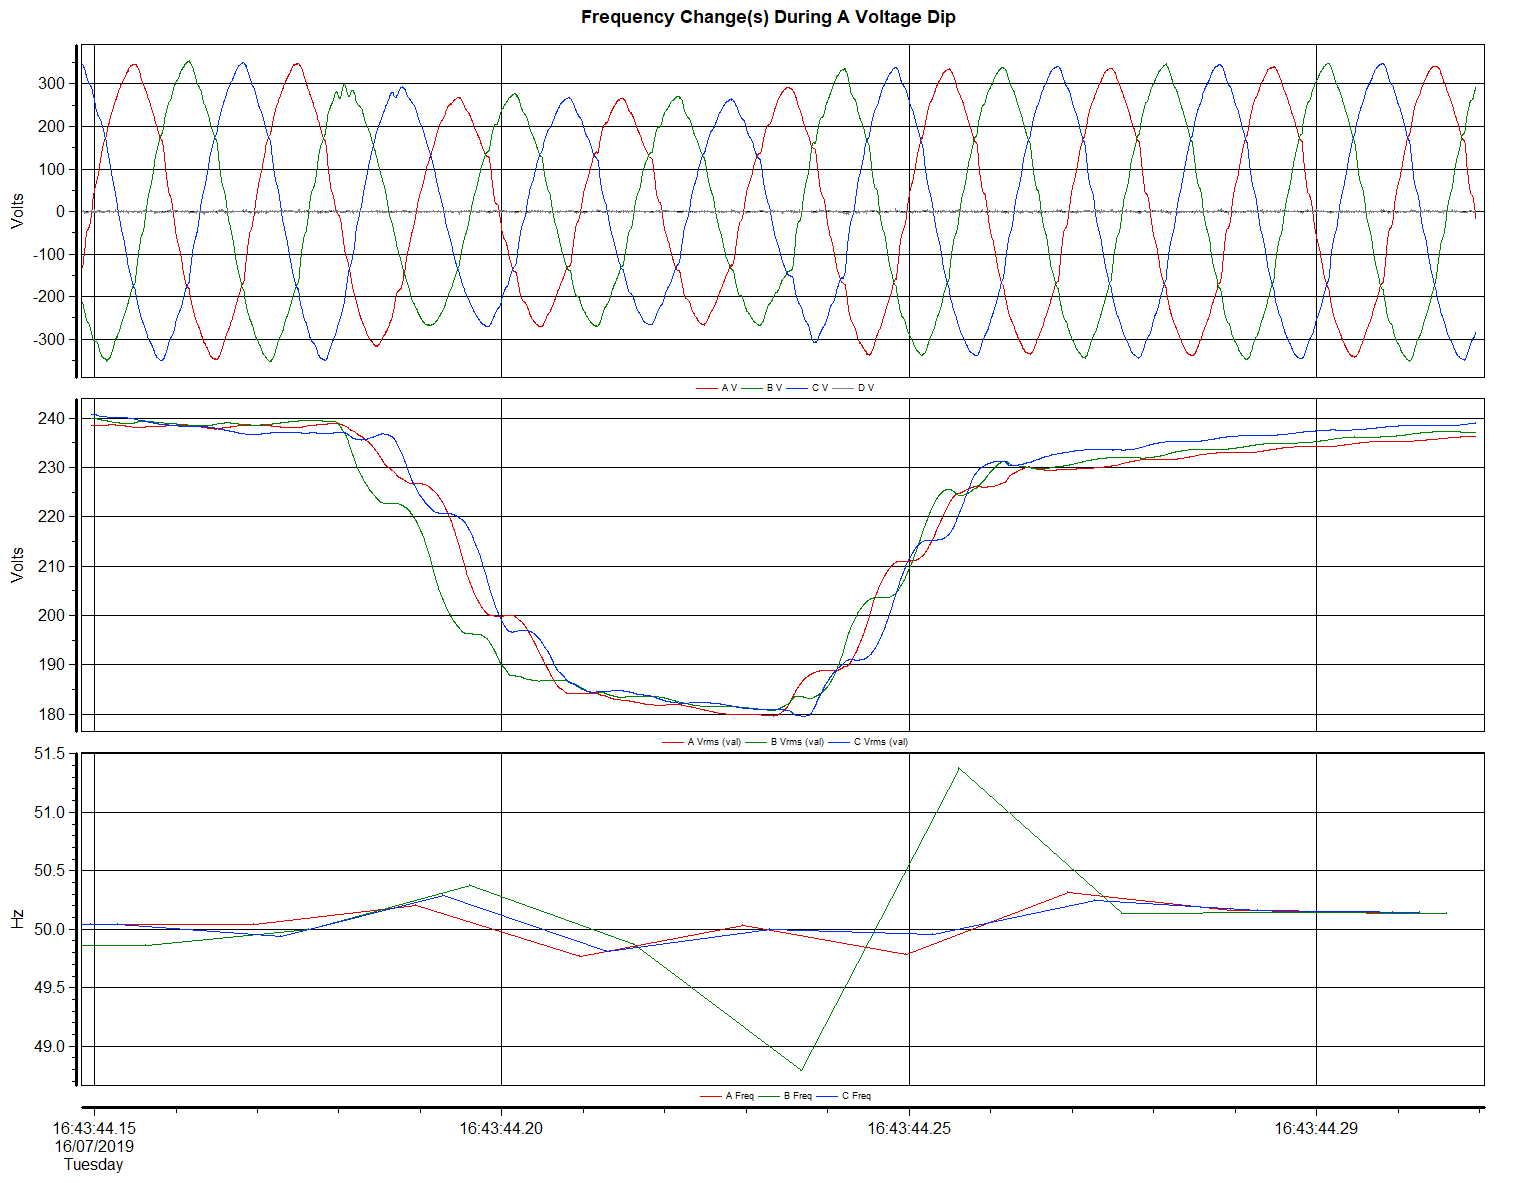
“Does frequency changes during a voltage dip?” – A favourite question among many. The answer is “Yes”.
This will be quickly followed by “But why our power quality monitor did not show significant changes in the frequency values even though a voltage dip event was captured?” The general answer is that the standard (IEC 61000-4-30) does not require it to measure such detailed changes in frequency values.
With the voltage waveforms captured, it is technically possible to calculate the frequency values during a particular event (say a voltage dip). Here’s an example, where the event waveforms were post-processed (via the Dranetz Dranview 7 software).
Such post-processing feature is very useful especially in generator load-test applications, where one will be interested to know both the voltage and frequency changes during every step-load change. An example is shown below. One just need to ensure that the pre/during/post event waveforms were set to be captured properly (i.e enough cycles). The software will do the rest.