Definition: Temporary reduction of the r.m.s voltage at a point in the electrical system below 90% threshold of the declared nominal voltage, between 10ms and up to a minute.
Voltage Dip (RMS Trend)
Simply speaking, a sudden voltage drop of more than 10% of the declared nominal voltage. The utility in Singapore has in place a Power Quality Monitoring System (PQMS) from 22kV voltage level upwards (all the way to 400kV). These are three-wire three phase systems; and hence line to line voltages are used in defining a dip.
There is a significance of such definition being used in the 66kV and 22kV networks, whereby it is a resistively earthed grounded system (thru the neutral ground resistor). Here, a single phase fault will not be a registered as a voltage dip as the other two non-faulted phases will swell; ‘compensating’ the faulted phase. This will result in a drop of voltage (line to line) of usually less than 10% (hence not a dip). The utility here described such events as ‘Voltage variation’.
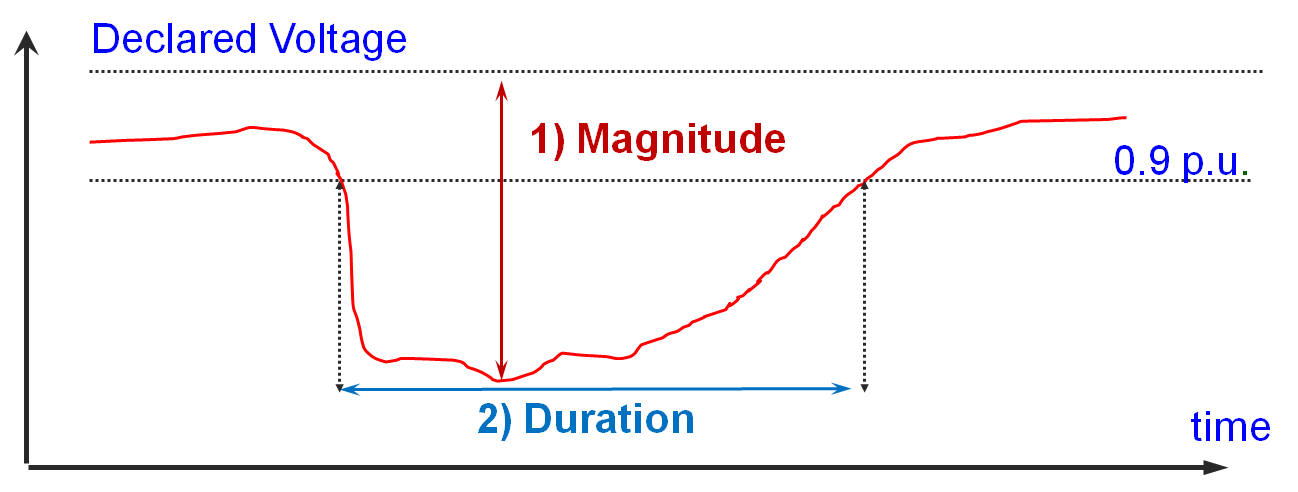
Two things matter when it comes to describing a voltage dip.
1) Magnitude of the dip
This typically reflects the fault severity and also the proximity of the monitoring point to the fault location.
2) Duration The timer starts when the voltage falls below the 90% threshold and ends when all voltages are equal to or above the 90% threshold. This is very much dependent on the time taken to isolate the fault and the nature of loads connected.
Normally a voltage dip here in Singapore will lasts less than 200ms (10 cycles). This is about the average time the primary protection takes to isolate the fault from the network.
Usually a longer duration will suggest a somewhat sluggish protection relay operation.
Typical causes of a voltage dip in Singapore:
1) Equipment / cable faults in the utility network.
2) Equipment / transmission line faults in Tenaga Nasional Berhad (TNB) network (Singapore is connected to Malaysia at 230kV).
3) Customer Installation faults.
4) Cable damage by earthworks.
5) And to a very small extent, load switching like motor starting.
Singapore’s electricity regulator, the Energy Market Authority (EMA) publishes cases of voltage dips on its website.
Earlier today, at about 2 plus in the afternoon, you might have noticed your office lights flickered, the escalators came to a standstill or that the chillers had tripped.
Enough clues to guess what could have been the cause?
Yes, you guessed it right. There was a transmission level fault, hence causing an islandwide voltage dip.
Here, in Singapore. a voltage dip is defined as a drop of more than 10% of the nominal voltage (Line voltage). It typically lasts around 200ms.
In Singapore, the transmission network consists of a 400kV network, overlayed onto 4 x 230kV blocks. The 230kV blocks were split up in the mid 2000s, for controlling of fault level.
It has inherently brought an advantage: Minimize the impact of a voltage dip due to a 230kV transmission fault to just that particular block.
Hence in a 230kV fault, only connected customers in that particular block which the fault occurred will ‘see’ severe dip values (in the ranges of 40-50% dip by magnitude); Customers in the lower voltage levels (66kV, 22kV etc) of that block will see similar (as seen at 230kV) dip severity or less (slightly). The other 3 blocks will see significantly less severe voltage dip or just a slight variation of the nominal voltage.
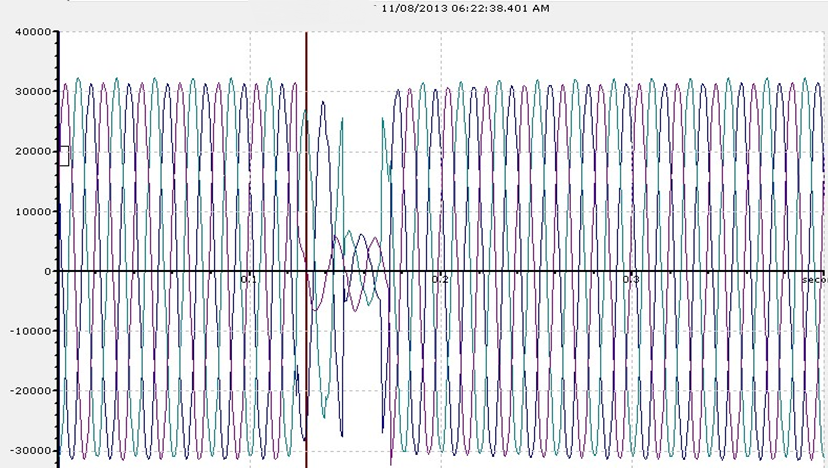
This is what happened earlier. Below is the 22kV (Line to Line) voltage dip snapshot, captured from one of the monitoring sites in the western part of Singapore.
22kV Voltage Dip Waveform 30-10-2013 1413hrs
Monitoring sites in other parts of Singapore also registered similar dip patterns, suggesting a transmission level fault.
This brings me to the conclusion that
1) This was a 230kV single phase fault on the L3 (Blue phase) in the western part of Singapore. UPDATE 31/10: Official Letter from SP PowerAssets: 230kV Cable damage – between Tuas Substation and Jurong Pier Substation at about 2:13 PM, 30/10/2013.
2) An L3 fault occurred. This affected V23 and V31 significantly. Hence you can notice both V23 and V31 ‘dropped’.
Singapore’s 230kv network is solidly grounded; hence any single phase fault will cause the other two non-faulted phases to ‘drop’ slightly too. This is unlike in a resistive earthed grounded system, (thru the Neutral Ground resistor) where the other two non-faulted phases will swell.
Here it also shows the advantages of having a power quality monitoring system installed. With both voltage and current waveforms recorded during a dip, it will assist the experienced engineer in analyzing whether the drop in voltage was caused by a fault downstream (internal fault) or originated from the grid (external fault); and hence assist him in quicken the restoration time for equipment that could have tripped due to the voltage dip.
There used to be a time whereby the price between a non-True RMS (aka Average Responding) and a True RMS meter/clamp is pretty significant; so much so that if one is just to measure voltage or current for checking if the circuit is ‘Live’ or not, one will go for the cheaper Non-True RMS device.
Recently, price difference have narrowed down quite a bit and in my opinion, one should just get a True RMS meter/clamp straight away.
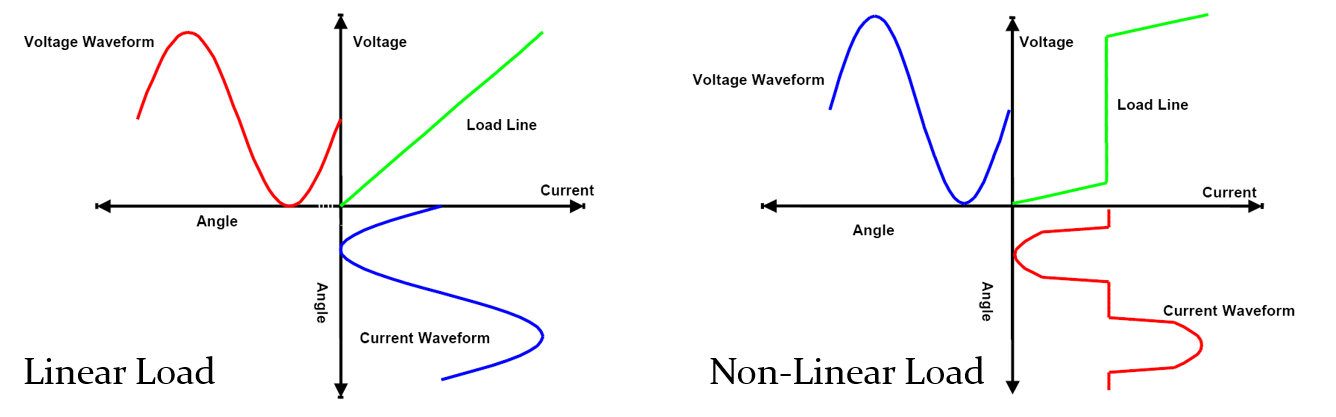
Loads today are pretty much almost non-linear these days anyway.
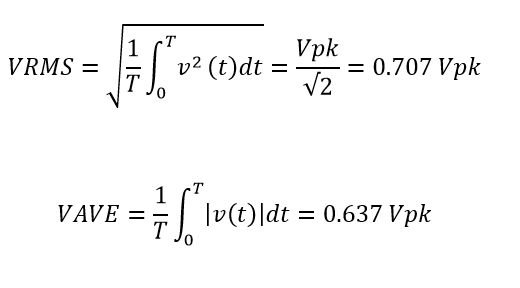
For a pure sinusoidal wave;
true rms vs average responding
Hence for an average responding meter, it will scale the rectified average of the ac waveform by 1.11.
This holds true only for pure sinusoidal waveform; which do not exist in the practical world.
The difference in reading can vary from between 5 and 40%, depending on what type of waveform that is being measured.
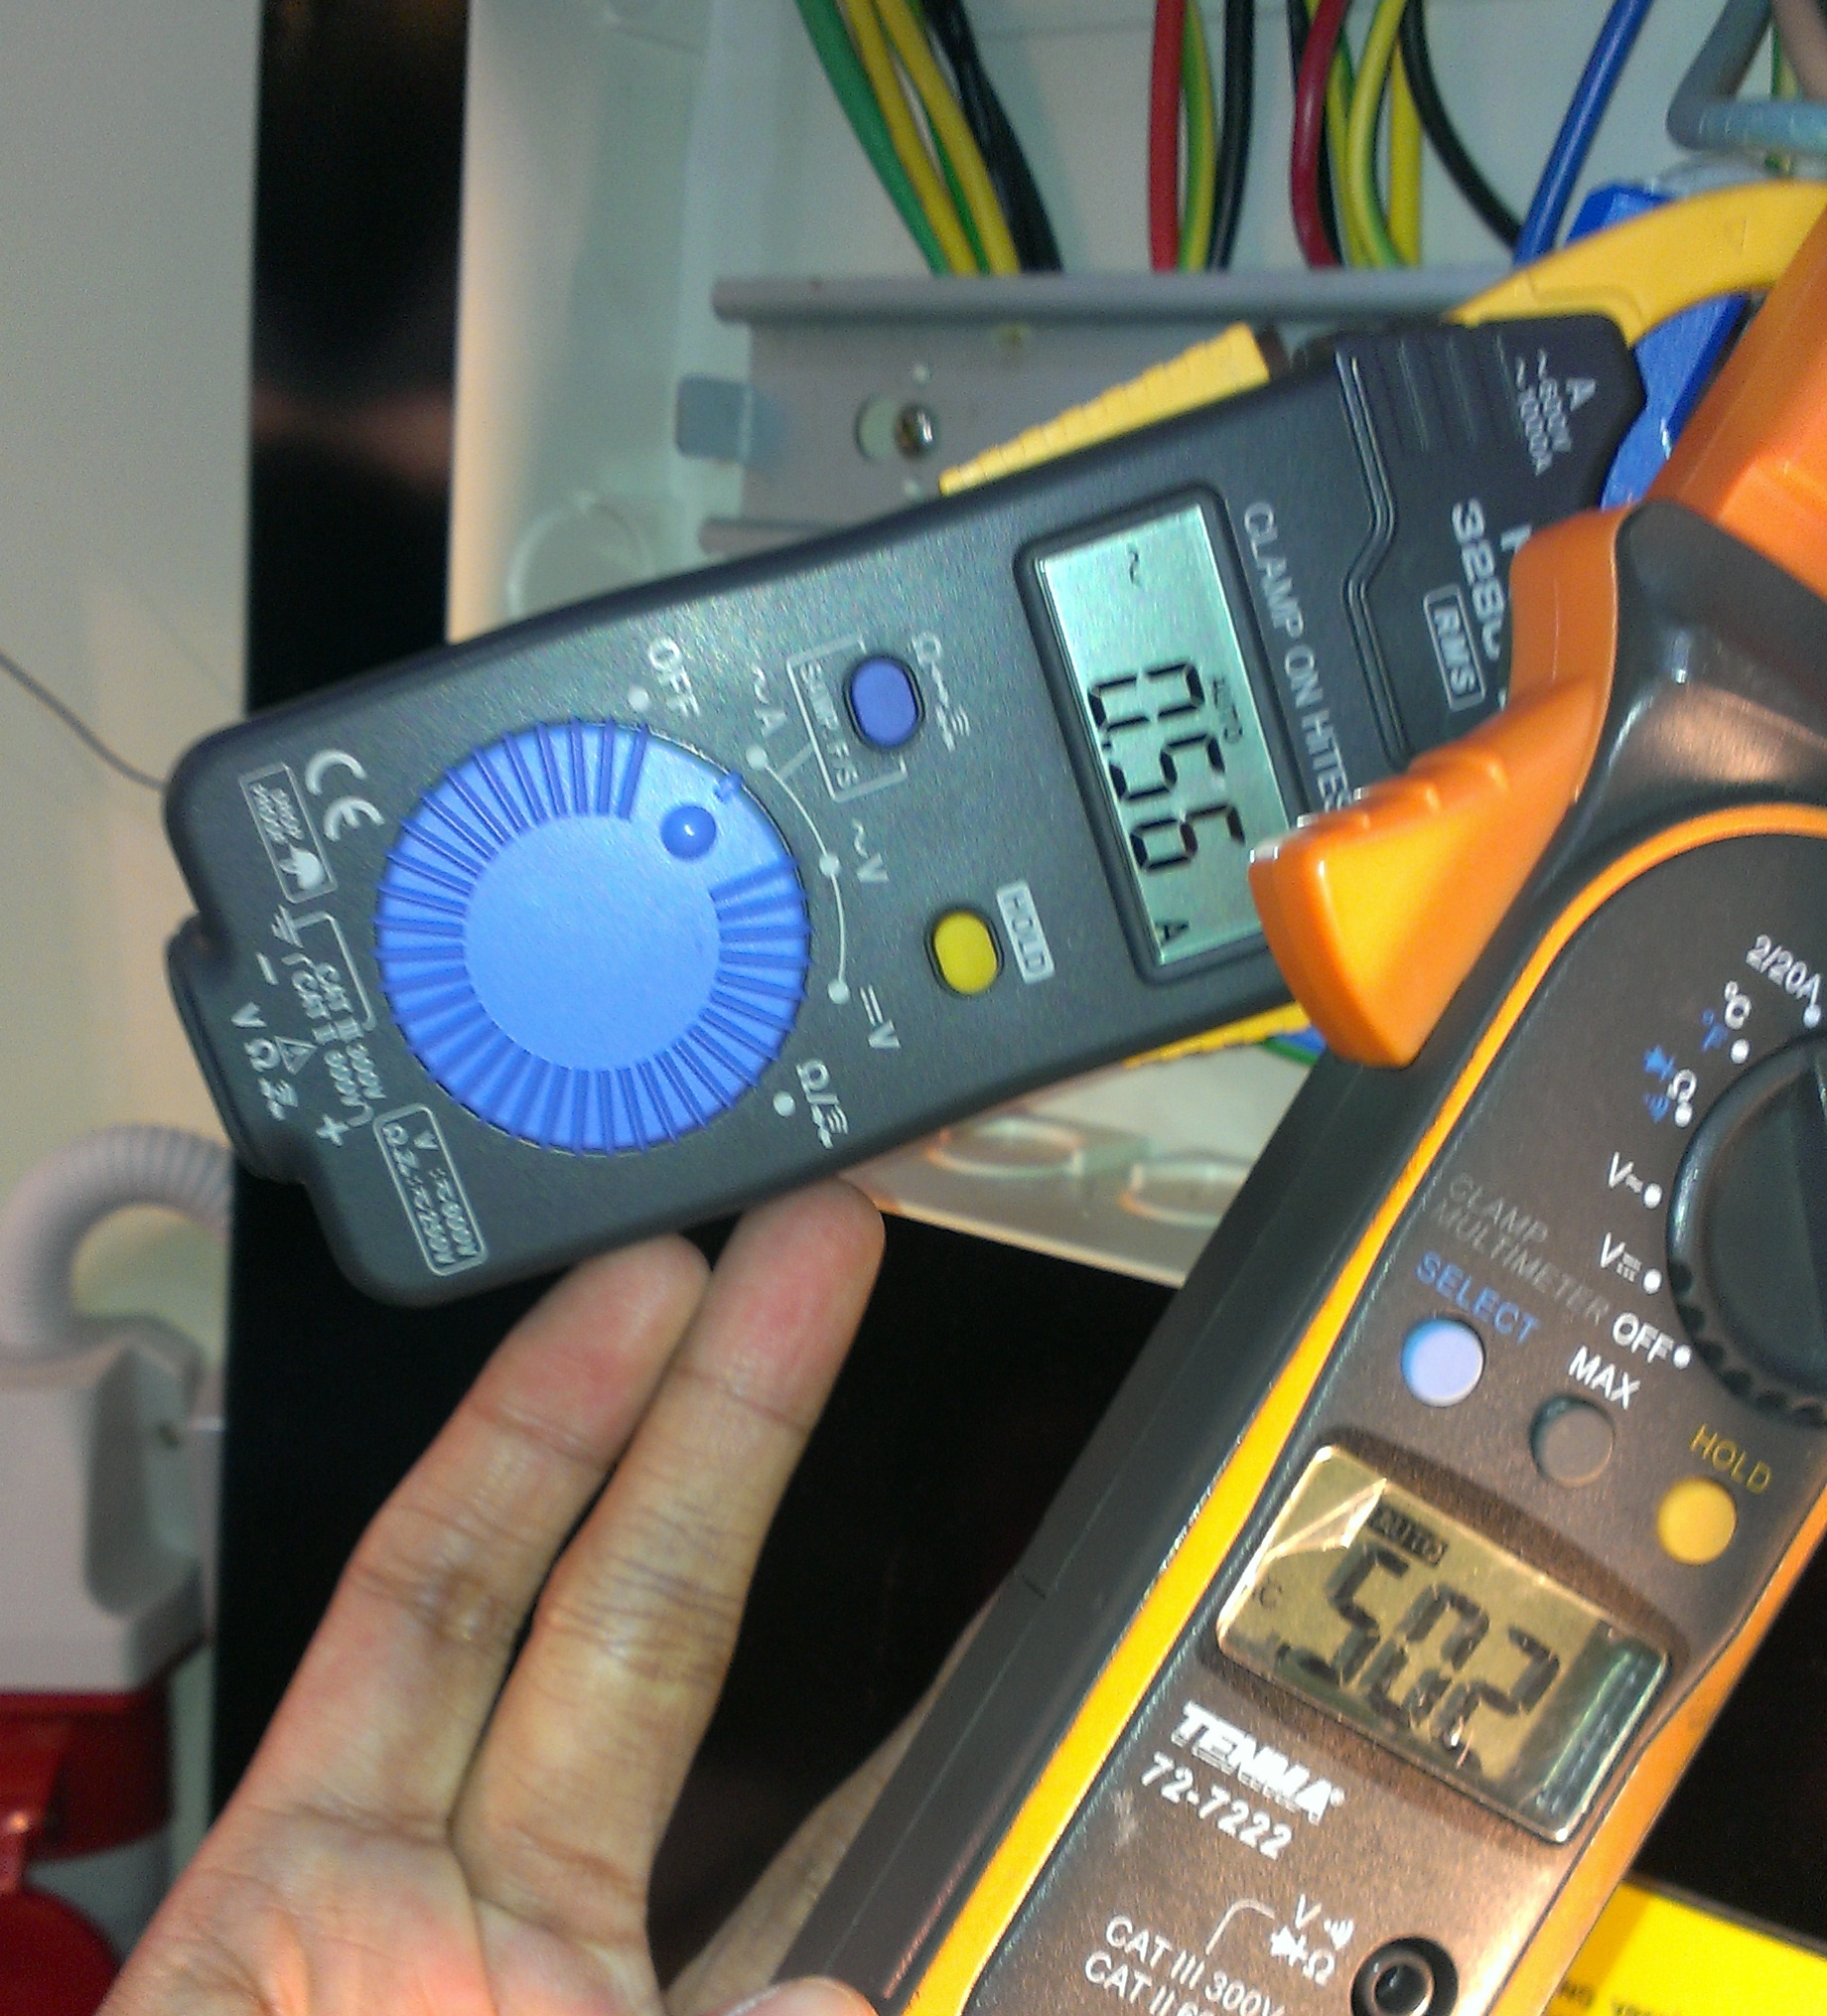
An example below shows a difference of about 10%. The load being measured was a combination of a couple of CFL and LED bulbs.
It is funny to me to see some contractors out there who uses a non True RMS meter/clamp to verify the readings obtained from their expensive PQ meters.
True RMS vs Average Responding Clamp
*Besides True-RMS capability, one should also check for its Safety CAT category. This is an important safety consideration that should not be disregard.
Power quality monitoring serves two main purposes:-
1) Benchmarking purposes: tracking loading and PQ indices (eg, harmonics, unbalance, flicker) over time, comparing against utility guidelines or known standards from the United Kingdom Engineering Recommendations, IEC and IEEE.
In Singapore, limits introduced in the Energy Market Authority’s Transmission Code took many references from the UK especially. An example is the voltage flicker / fluctuation limits; they are referenced to UK E.R P28: Planning Limits for Voltage Fluctuation Caused By Industrial, Commercial and Domestic Equipment in the United Kingdom. Another example is the Voltage harmonics limits which were referenced to the UK E/R G5/4: Planning levels for harmonic voltage distortion and the connection of non-linear equipment to the transmission networks and distribution networks of the United Kingdom.
In the market, there are two types of PQ monitoring available: permanent or portable. Traditionally, permanent PQ monitoring was exclusive to the utility companies. However over time, as PQ monitoring devices became more affordable and due to increased awareness regarding power quality, many buildings and manufacturing plants started to have PQ monitoring in place, sometimes integrated together with their internal Building Management System (BMS).
One known use of such system here in Singapore is to assist the facility managers whether can they restart / normalize their equipment (eg chillers) after they tripped following a voltage dip in the network. By having both current and voltage waveforms captured during a dip, it becomes a handy tool to inform the manager whether the fault (and hence the dip) originated upstream or an internal plant fault. Knowing that the fault originated upstream in the network will enable the manager to skip some checklists, hence faster restoration time (and less downtime).
2) Investigation purposes:whereby it has been determined that a power quality meter / instrumentation is necessary to aid in solving a particular power quality problem. In this particular case, a portable power quality meter is almost used. Note: there are instances too whereby a permanent type of PQ meter was made portable by installing it in some portable hard-case housing.
ION 7650 made portable
I have used several portable power quality meters, the first one being the HIOKI 3196 during my university internship days. I then went on to use other PQ meters like the Fluke 435 Series I, Fluke 434, Fluke 1750, Fluke 345, Hioki PW3198, Dranetz-BMI PX-5 Power Xplorer and Elspec G4500 Blackbox. These are the meters that I have used on an almost daily basis and I will be describing their strengths / weaknesses here based purely on my own experiences. (Note: I am not tied to any PQ meters manufacturer)
1) Fluke 435 Series 1
The Fluke 435 is an IEC 61000-4-30 Class A PQ instrumentation. It has several recording modes like Harmonics, Flicker, Dips/Swells, Inrush and a “Logger” mode.
Hardware: There were little differences between the Fluke 434 n 435. The F435 however have the “Power Logger” mode, hence trending of various parameters was a useful function. The major drawback is that when in “Power Logger” mode, the meter would not be able to capture any waveforms. In the event of a voltage dip for instance, a text one-liner will indicate that a dip has detected during the measurement, but no waveforms whatsoever. Another drawback is the maximum recording of 100 parameters only. This is a major drawback for me personally, as that will mean cutting down on the trending of the no. of individual harmonic orders. There is also no high speed transient capture capability.
Software: Powerlog has improved over the years, with the latest version (4.02) having a “clean and nice look” to it. It is adequate for most power quality trending analysis. It has also a useful data distribution histogram for statistical analysis. However my personal preference is to display harmonic current in terms of RMS amperes or in Total Demand Distortion (TDD). To do that, I will have to export out the fundamental current and various individual harmonic current % and re-do the calculation manually in excel. In certain applications, one may need to record the various parameters in 10-min trending (for eg) but requires 30-min values for maximum demand purposes. There is no feature to do that here, other than setting the F435 to record in 30-min intervals in the first place.
Fluke 435
2) Fluke 434
Hardware: I had used the F434 version without the logging memory function. Hence there is no capability for it to log down trending values (eg aggregated 10-min trending). Hence this was its major handicap.
Software: Having used other software, Flukeview isn’t really good for me, but that’s just my personal opinion.
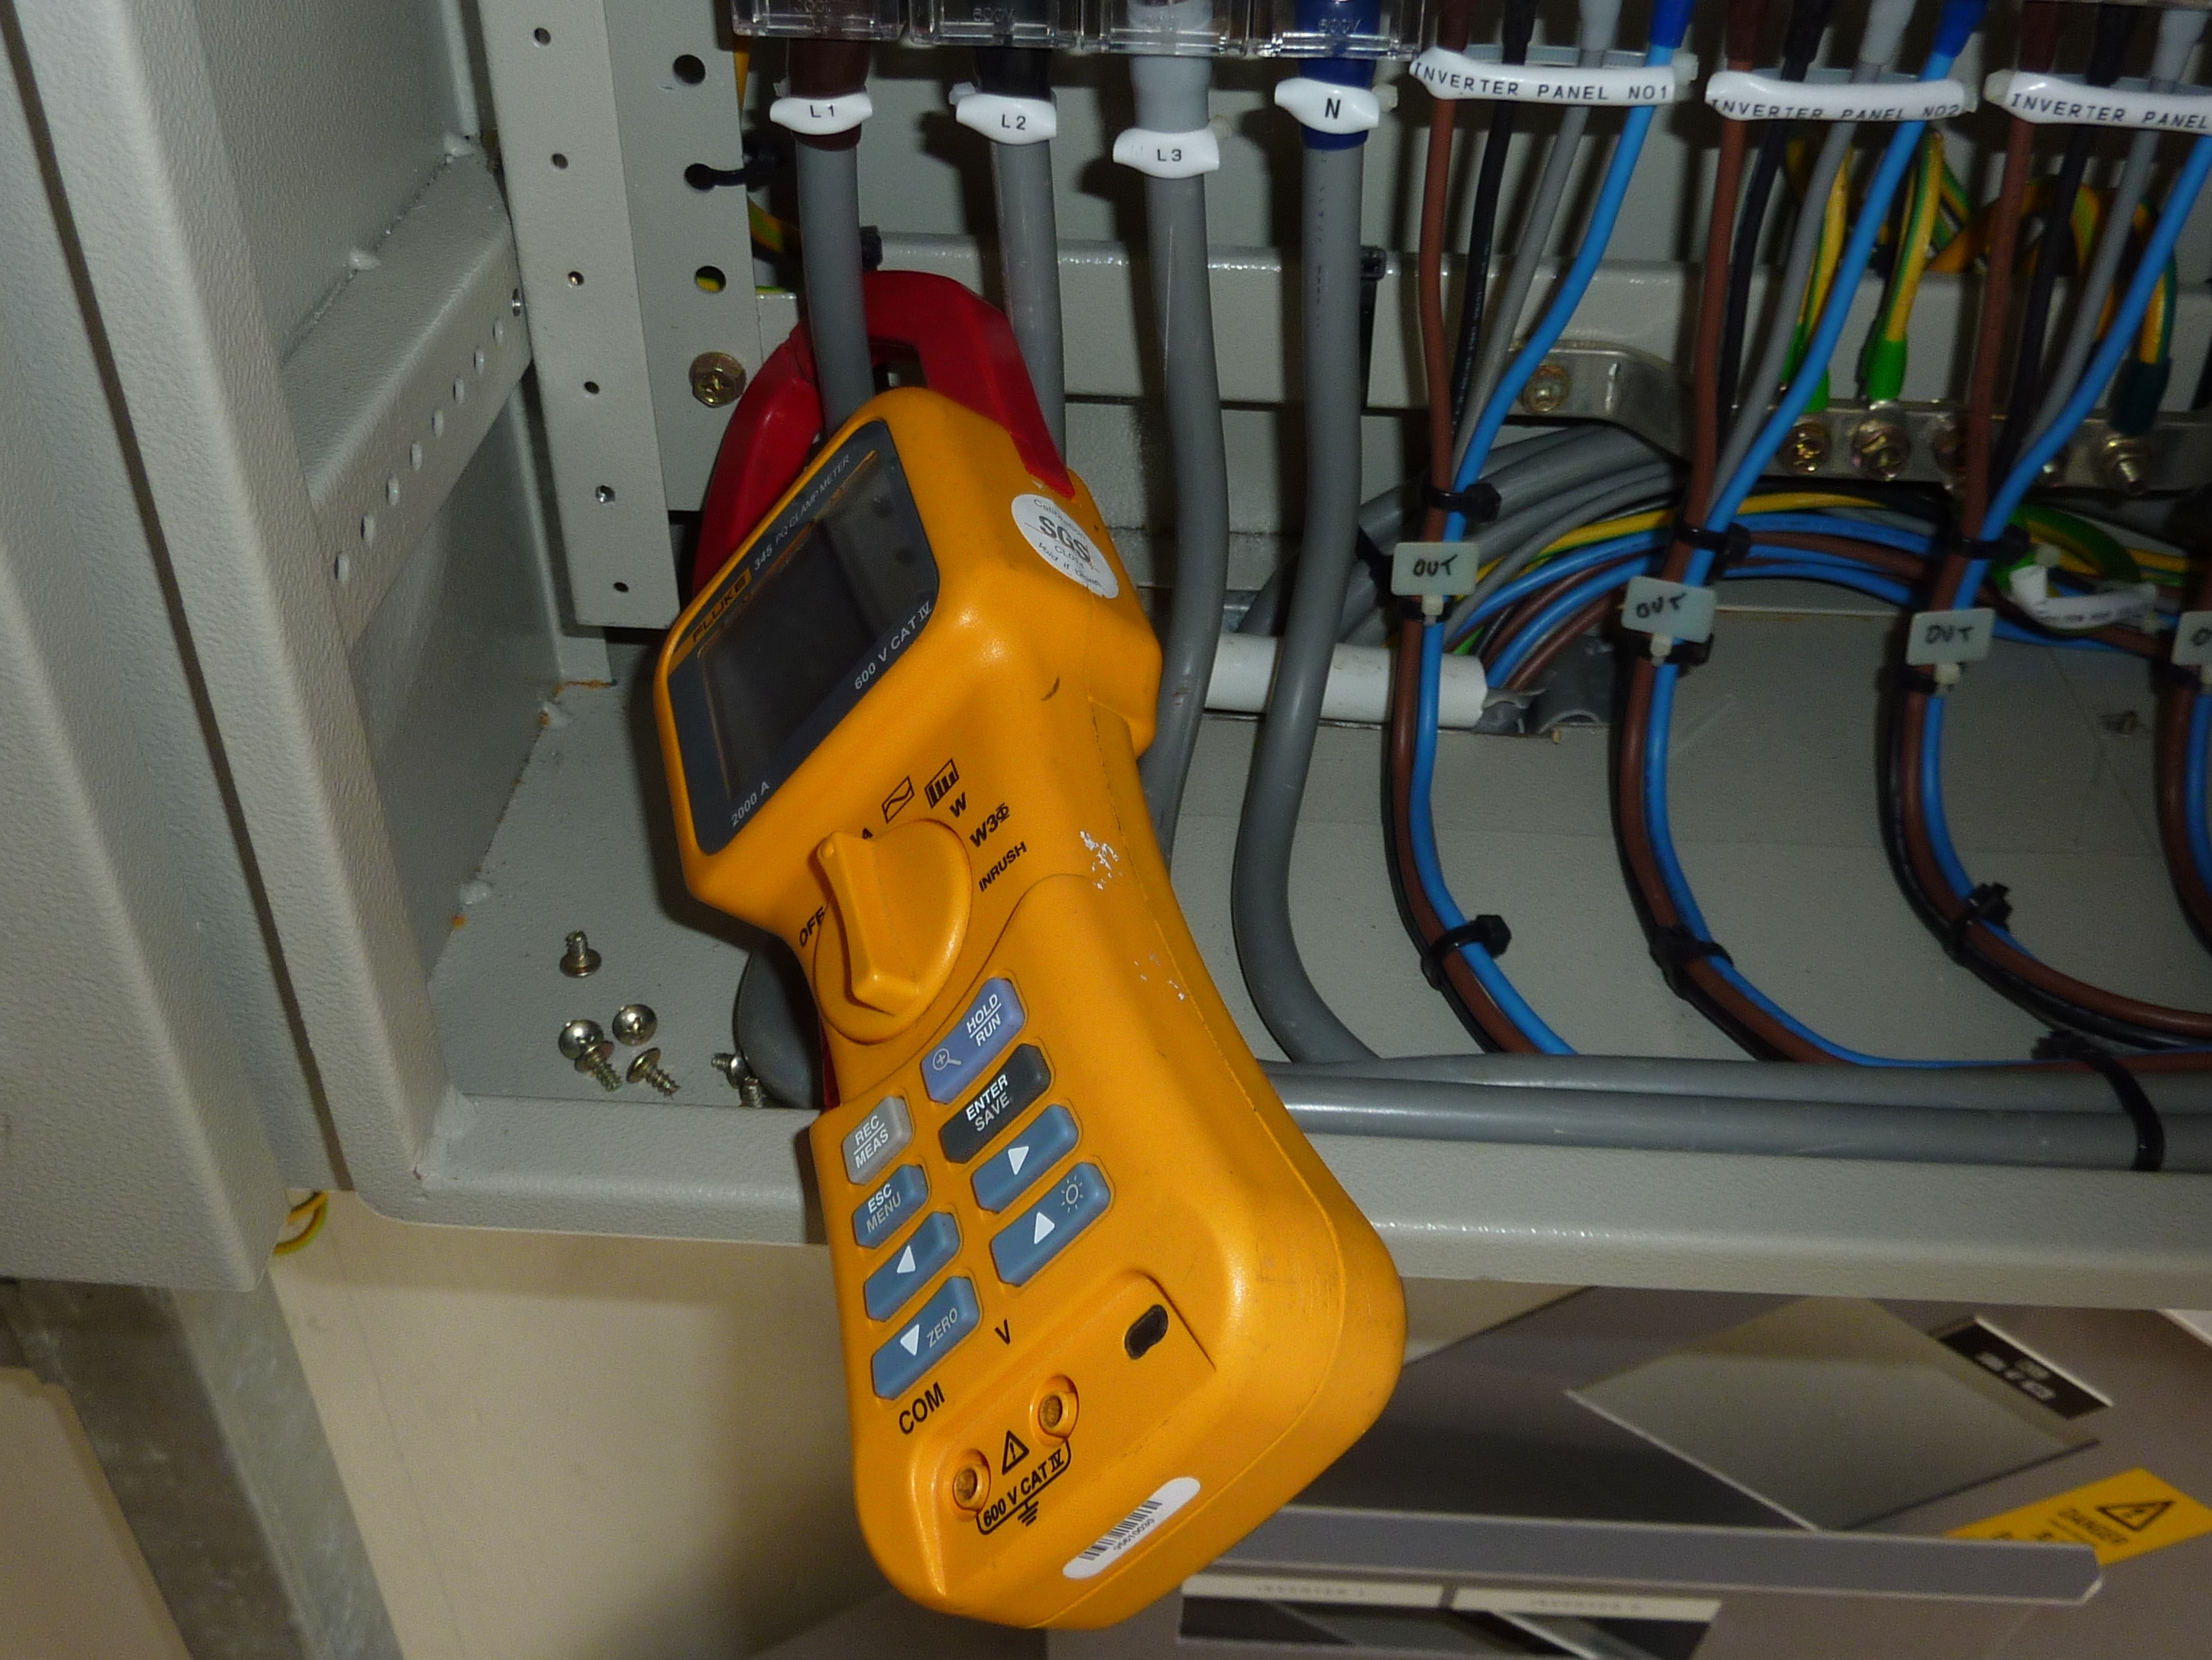
3) Fluke 345
The Fluke 345 is a single-phase AC/DC power quality clamp that I personally used to measure DC amperes in the presence of AC in Grid-Tied PV applications, to check for the presence of DC injection back to Grid.
Hardware:
Truth to be told, there isn’t any instrumentation available in measuring small amount of DC in the presence of large AC. This is a great tool nevertheless for spot-measurements and verification of loadings when installing a portable power quality meter.
Software:
via PowerLog. Same comments as above.
Fluke 345
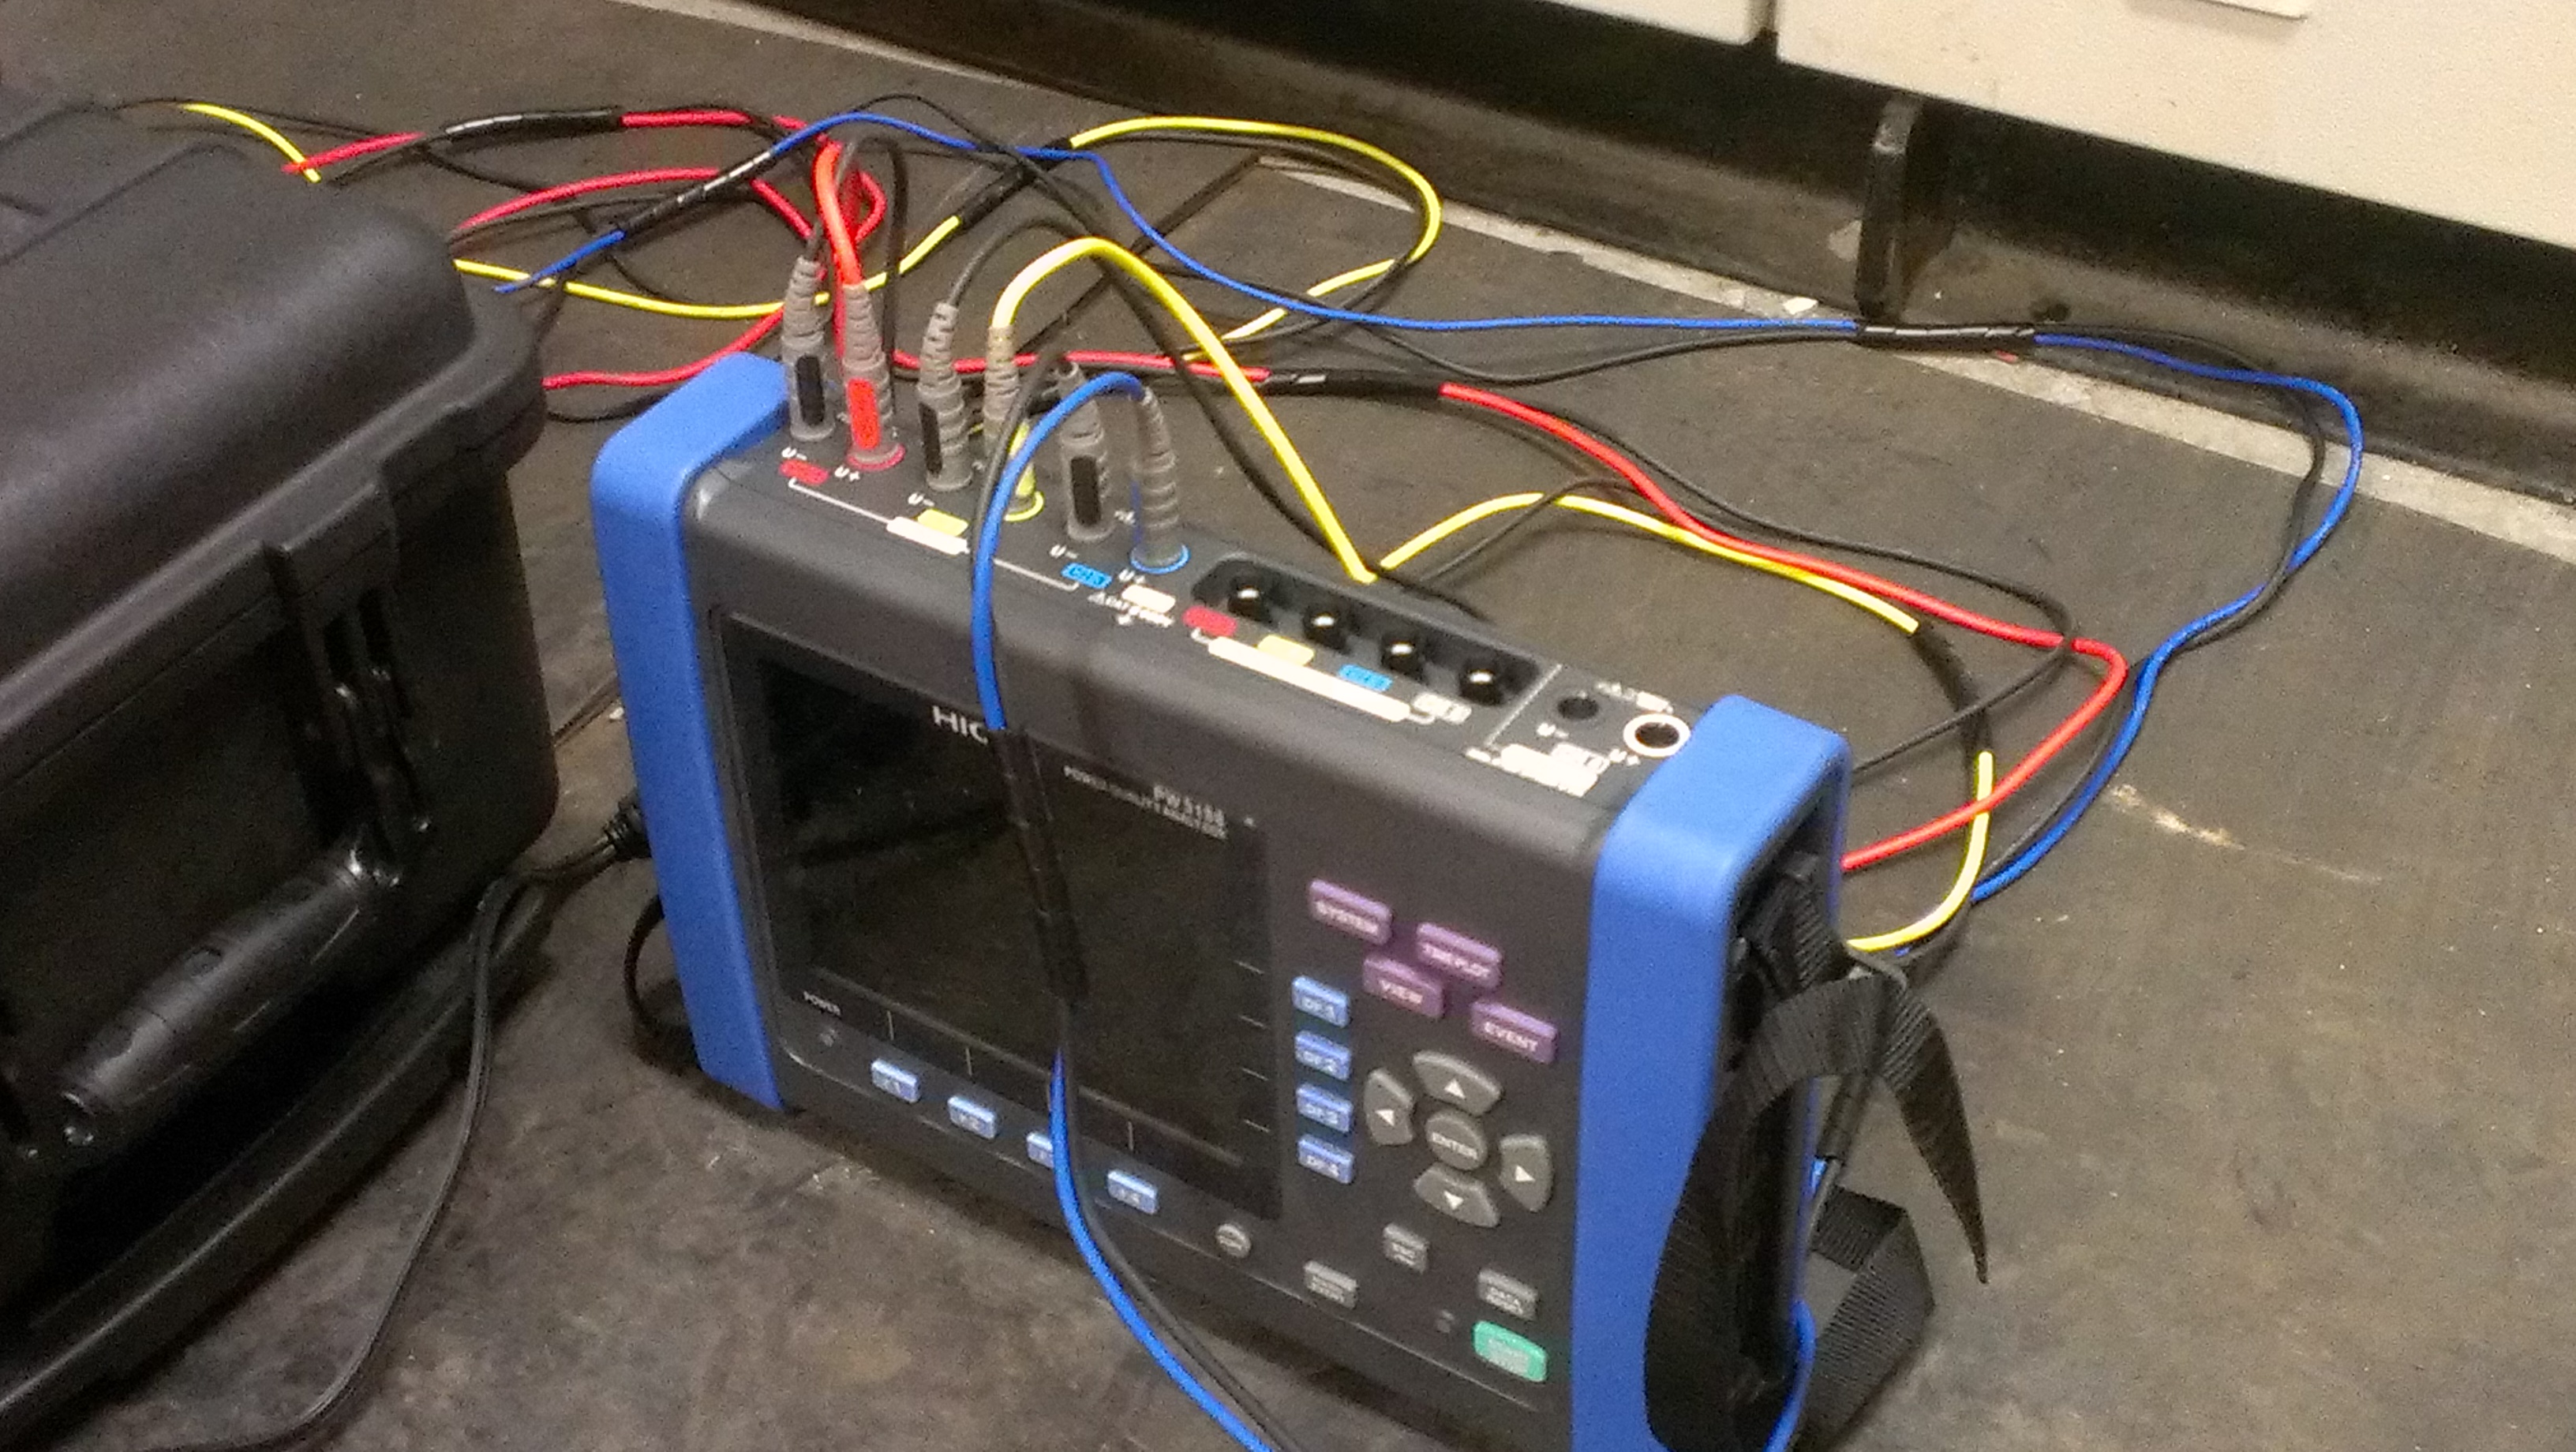
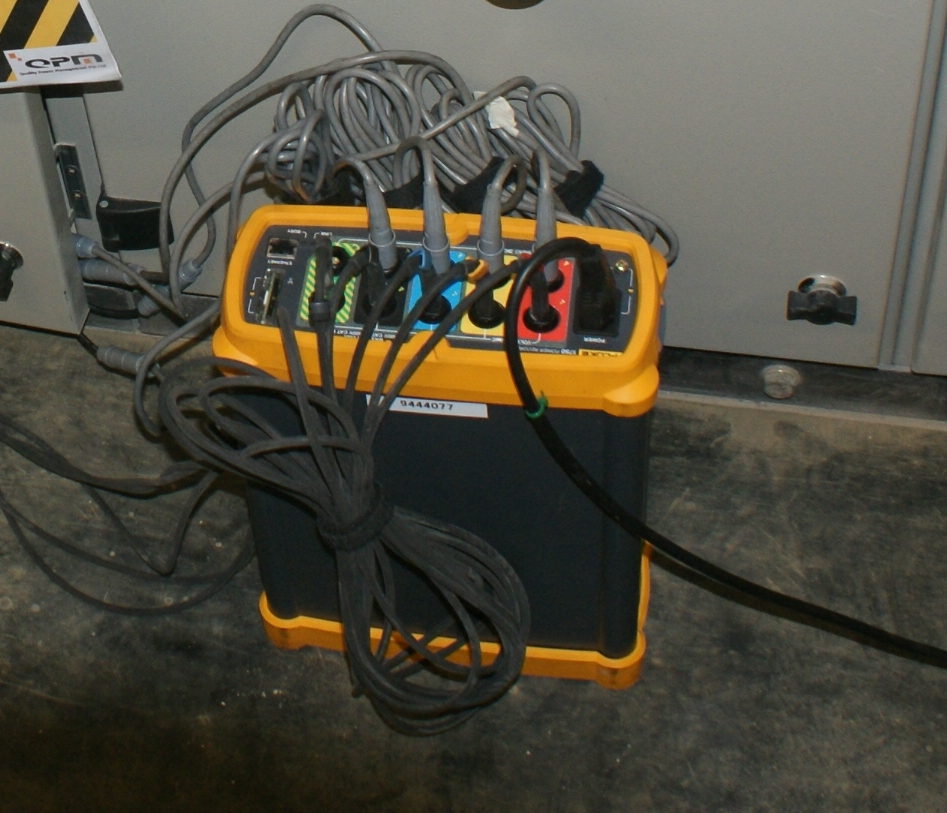
4) Hioki PW3198.
This is the latest PQ meter that recently arrived in my hands. It is a Class A PQ meter, able to record trending and capture waveforms too if certain thresholds set are breached.
Hardware:
In my opinion, this is a much better PQ meter than the Fluke 435 Series 1. There is no limitation on no. of parameters to be recorded and it can record trendings and waveforms together (that is how a PQ meter should function, in my opinion). It is also able to capture high speed transient. Two disadvantages that I come across are as follows: 1) Two voltage inputs (+ and -) for every phase, hence the physical connection for a three phase wye will be different from a three phase delta. I have witnessed minor accidents where users were not familiar in a three phase delta setup, causing short-circuits in the PQ meter. 2) For connection of custom Non-Hioki clamps to it, it can only accept clamps with certain mv/A ratio only (hence not fully 100% customizable)
Software:
Similar to the PowerLog, it is adequate for most power quality analysis. Also to add, it is able to trend out harmonic current values of the individual orders in terms of RMSamperes, which is good. It cannot however total up these values and give the user the total harmonic current (in RMS amperes). I have to export them out and calculate them manually via Excel. Another plus is that it is able to give 30min interval values for maximum demand, as compared to PowerLog via the F435.
Hioki pw3198
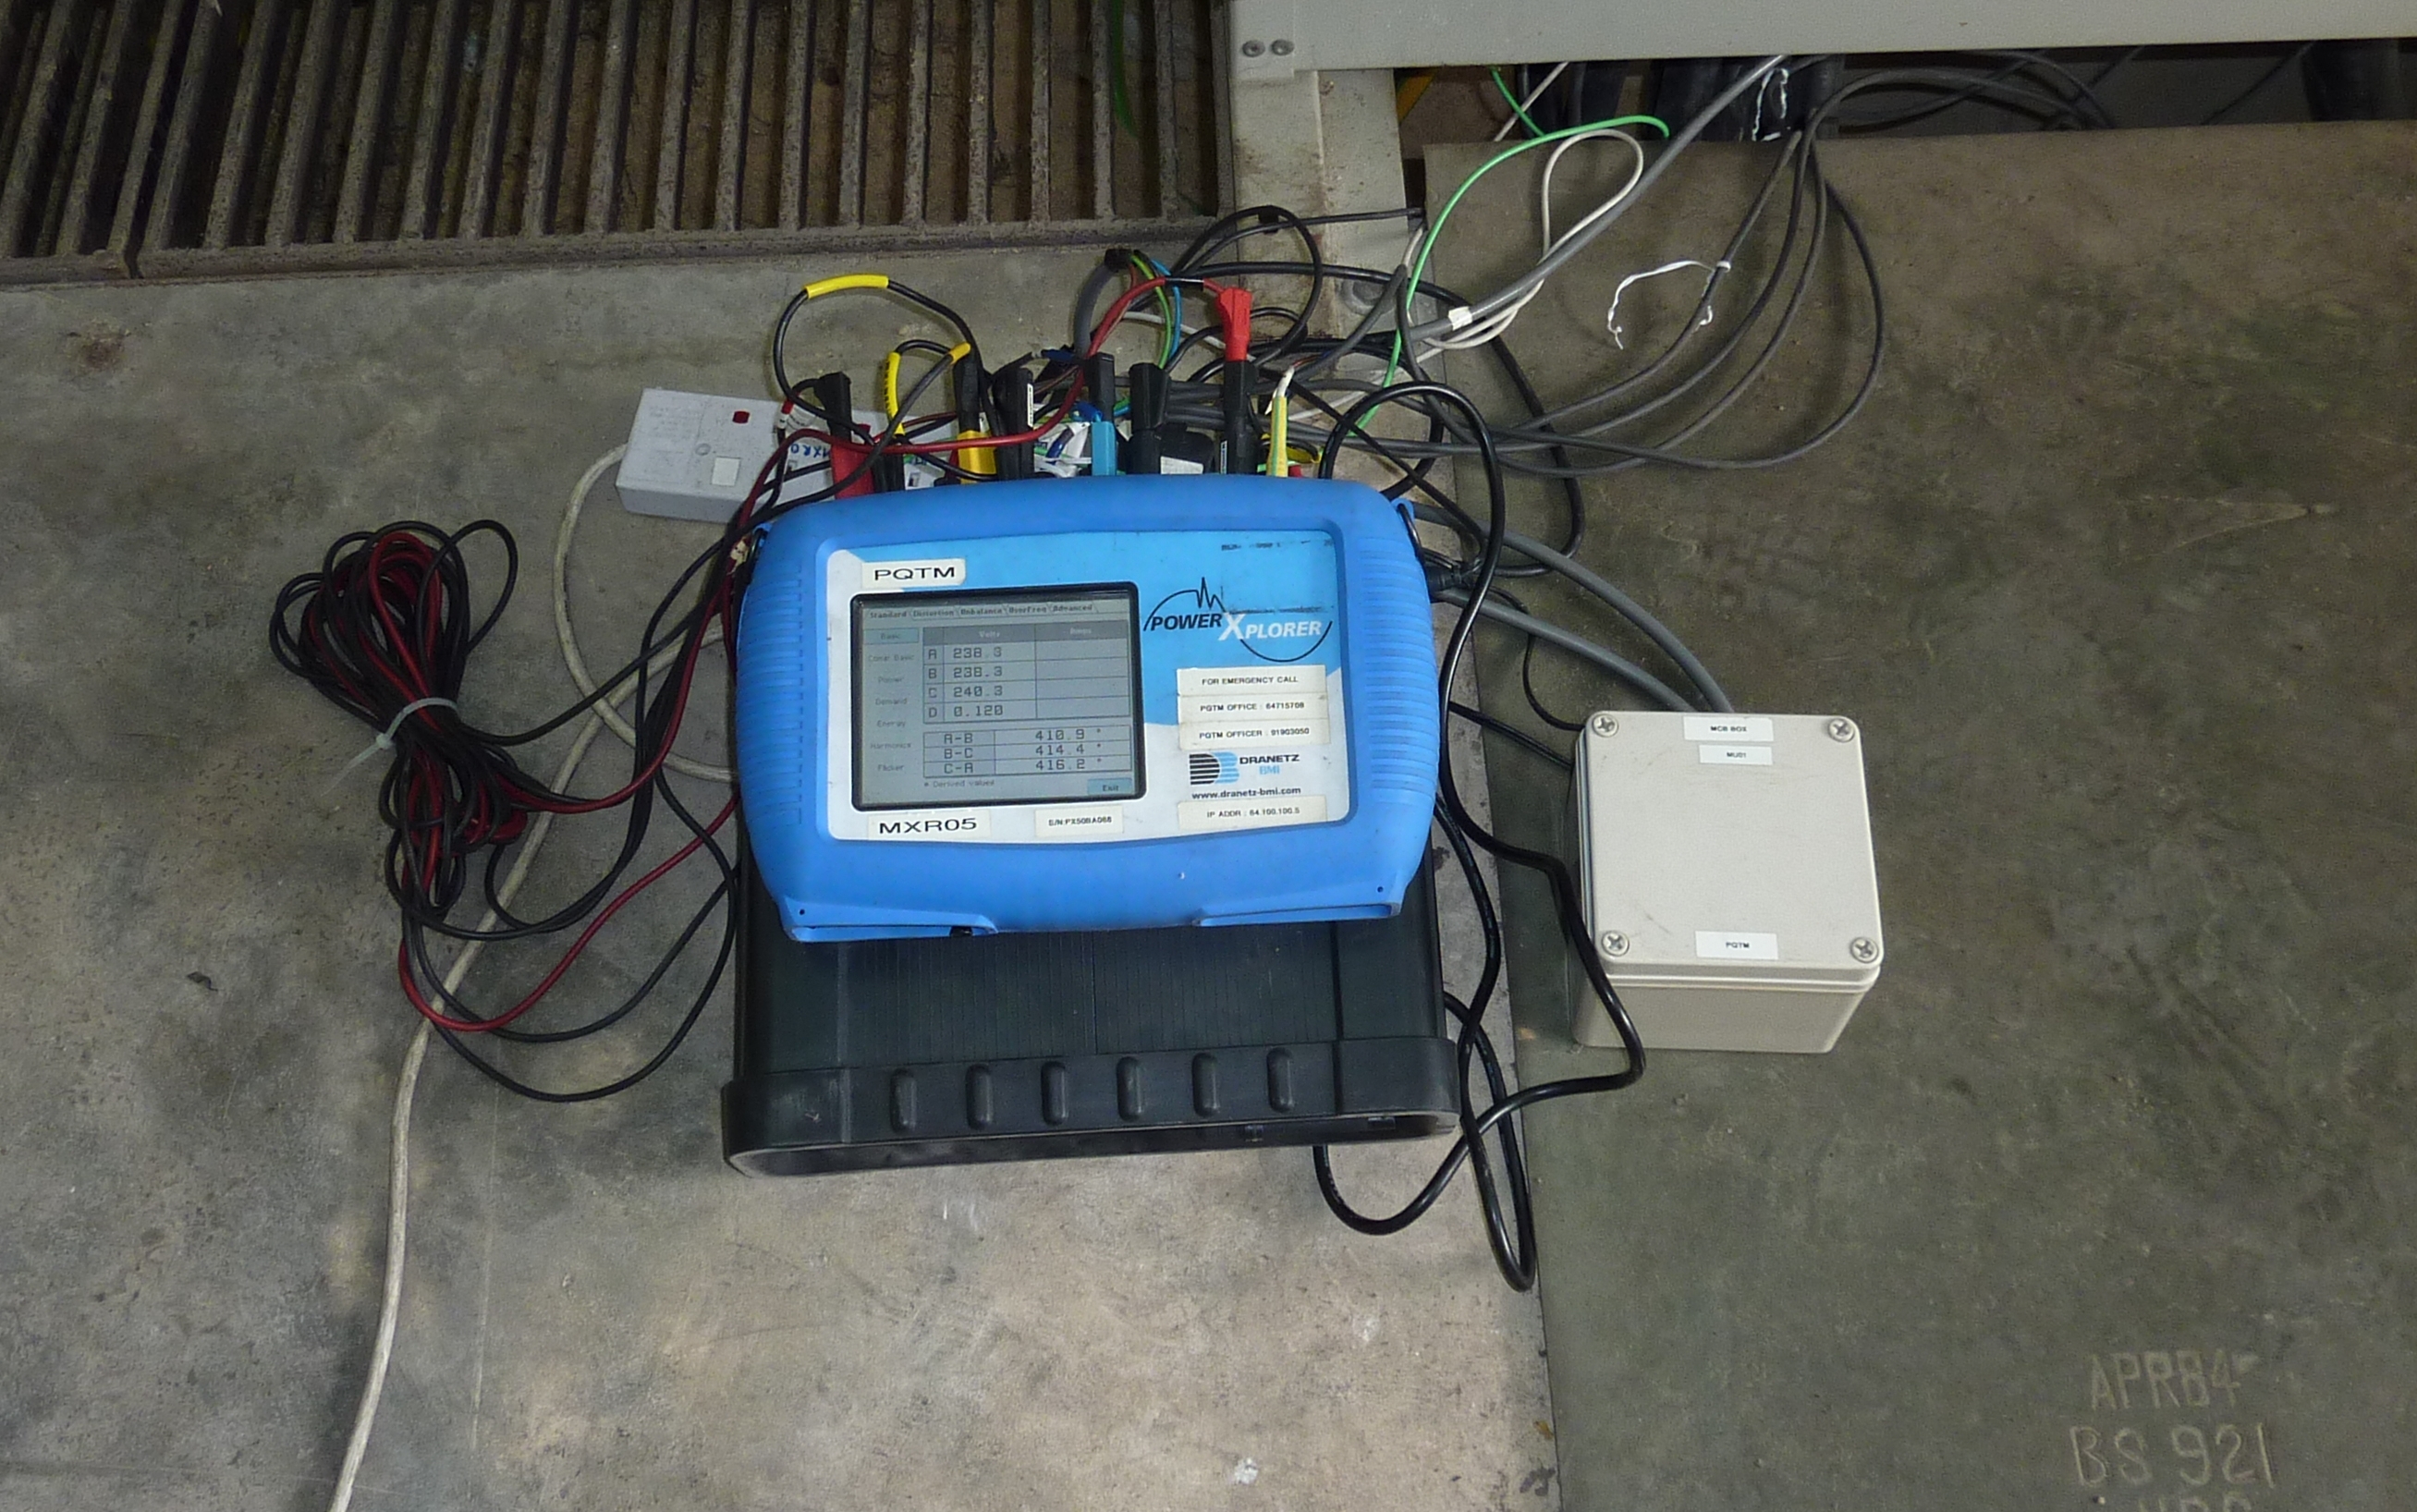
5) Dranetz-BMI PX-5 Power Xplorer
This is a Class A PQ meter from Dranetz-BMI with hi-speed transient capturing capability. It is able to record trending and capture waveforms at the same time.
Hardware: It has similar capability as the Hioki PW3198. Even its voltage input configurations are similar, meaning the physical configuration at the voltage inputs will be different between a 3 phase wye and a 3phase delta connection. IEC 61000-4-30 gives guidelines on how the average aggregation of the trending values must be:
By default; data assessed per 10min RMS values
10min interval -> 3000 10-cycle measurements
Average: from 3000 x 10-cycle RMS values
Minimum of 3000 x 10 cycle RMS values
Maximum of 3000 x 10 cycle RMS values
If you are familiar with PQ meters, there is also a maximum / minimum trending plot. On how this is implemented very much depends on the manufacturer, as it is not specified in the Standard. Dranetz-BMI used a single-cycle maximum/minimum value, meaning the maximum/minimum RMS value you will see is from a single cycle, not from a set of 10cycles. This helps greatly when one is doing troubleshooting purposes, and the waveform capturing mode didn’t activate as it was still within the ‘thresholds’.
There are also downsides for the PX-5. The flexible clamps that came with the meter were the LEM Flex RR3035A. Its connection to the PX-5 is via a ‘coaxial cable’ connection. Over time due to wear and tear, the ‘coaxial cable’ became loose easily and resulted in many unusually high current spikes recorded. Another problem I encountered was the overload of the circuit signals due to the wrong setting of the clamps’ measuring range (it has a range of 30/300/3000A). There was one occasion when I had set a low 300A measuring range and left it over night. Due to increase of loads in night time (loads went up to above 1000A, the clamps became saturated and caused many high frequency voltage transients to be recorded. I admit that it was my mistake, but I would have though that voltage and current were separate issues altogether!
Software: Dranview is by far the best power quality analyzing software ever. Nothing comes close to it in my opinion. The option of changing harmonic current to THD%, TDD% and its absolute values in terms of its RMS can be simply be done with a few clicks. Statistical analysis can be done with just adding on some tables to the trending graphs. I could go on and on over here !
Dranetz-BMI PX-5
6) Fluke 1750 Power Recorder
The F1750 prides itself as a PQ meter that “records everything” thru its “adaptive” threshold. It was previously an RPM PQ meter, acquired by Fluke. It has also a high speed transient capture capability.
Hardware: Though it has the benefits of “recording everything”, every cycle of it without setting up any thresholds it is not a Class-A compliant meter. You will not see in any of the specs saying it is Class A compliant but you may read that it measures according to Class-A algorithms. This is because its voltage accuracy is +/-0.2% instead of as required +/- 0.1%. And it does not have the ability to be time-synched to a GPS (though this is largely a non-issue to me personally as the practicality of connecting a GPS module to a PQ meter inside a switchroom is almost zero). Despite its shortcomings, the F1750 is useful in troubleshooting purposes and finding faults in a system for a short period of measurement. When a PQ meter captures everything, it will be up to the PQ investigator to be the smart one to decipher what is important or not.
Software: The current version is Power Analyze 2.4. It is still very much a basic analyzing software. I have used it since its early days whereby things like unbalance and flicker were not available options in the software. Things were then added on as time goes by. And if you notice properly, voltage/current unbalance can be found under the ‘THD’ tab. I cannot understand why though. I suspect that it ran out of tabs to display!
It can however gives me the individual order harmonic current in RMSamperes. Similar to the Hioki PW3198, I have to manually export the individual harmonic current (in amperes) out to calculate the total harmonic current in RMSamperes. However the ridiculous thing that I found is that the software only allowed me to export one individual order at each time only. That means I have to export out 49 times for harmonic orders 2nd to 50th!
Fluke 1750
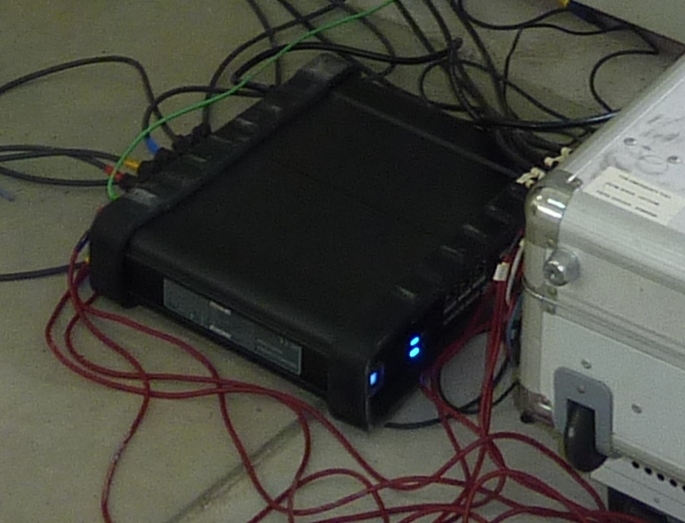
7) Elspec G4500 Blackbox
This is a port-over product from its permanent monitoring series. It is another PQ meter that prides itself in measuring every waveform (1024 samples per cycle for voltage) from start to end (I used the model which has 8GB memory). It is also a Class A compliant meter. It however lacks a high speed transient capture capability.
Hardware: It has an in-built router enabling wireless access to it. Physical inputs to the PQ meter are similar to F1750 / F435. Configurations whether it is measuring a three phase wye or three phase delta is configured via software. It has also an optional temperature probe. And it has these nice blue LED lights above every current and voltage input; to indicate if it is connected and measuring. Setting up is via web interface and is quite straightforward.
Software: An SQL database is firstly needed to be installed on the downloading / viewing PC. It has a basic software, adequate for most power quality analysis. It is able to trend out values in terms of both the IEC 61000-4-30 Class A guidelines or even in cyclic RMS (which will be more accurate). It can also trend out individual and total harmonic current in RMSamperes. Its biggest drawback and main handicap is its downloading and “unzip portion”, whereby it can easily takes half an hour to display the trending / waveform recorded over one week of measurement. In this sense, it is not very practical in my opinion, as many times, a PQ investigator or the Customer will want to view the data recorded almost immediately. A half an hour is simply too long. (used a Lenovo Thinkpad X220 I5-2520 4GB). My opinion is that it was originally designed for a permanent installation, whereby data is being brought back to the PC/server to download and process at fixed short intervals and not in the portable setup scenario whereby one week of data is downloaded and processed at once. It is a neat meter, if only the the downloading/viewing issue can be resolved.
Elspec G4500 Blackbox
In my opinion, if I am to purchase new PQ meters it will still be 5) Dranetz-BMI PX5 for its per cycle min/max and also its powerful software.