Power quality isn’t a new word or term. It has been around for ages. However if one is to search around, there isn’t much information available with regards to this topic here in Singapore.
It is very much still a niche area in the local electrical engineering scene.
Hence, the birth of this blog/site. It is the author’s intention to fill this gap of information here in this website and at the same time a platform to share the author’s views & experiences gained in the subject.
The author is currently the Lead Engineer at Potentia Dynamics Pte Ltd, an engineering & consulting company.
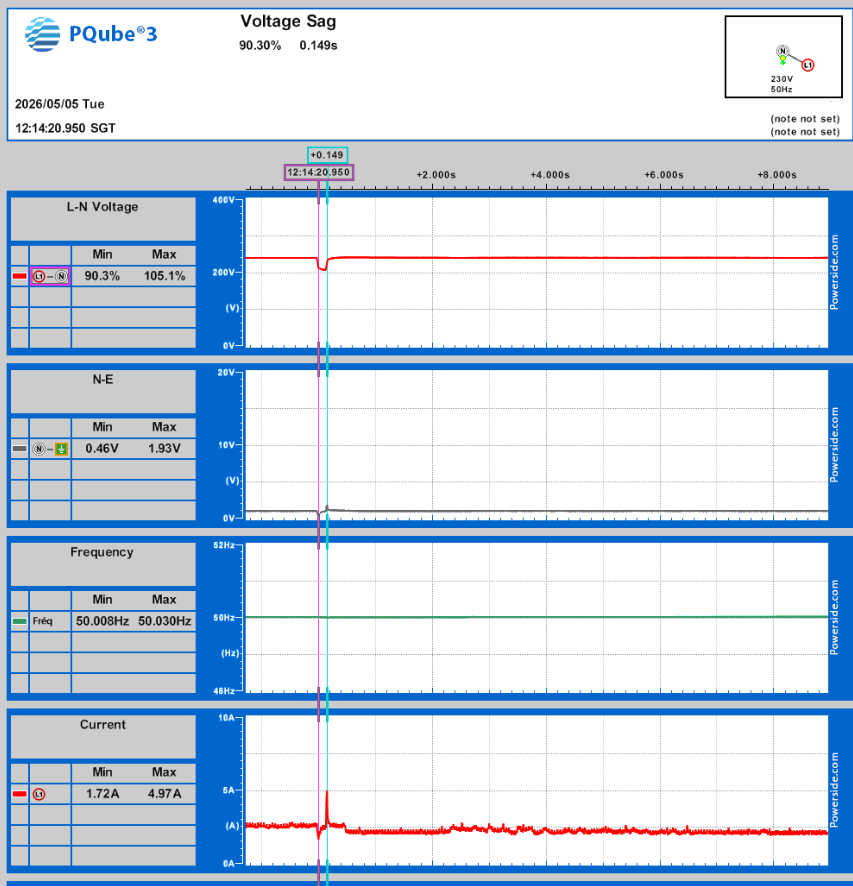
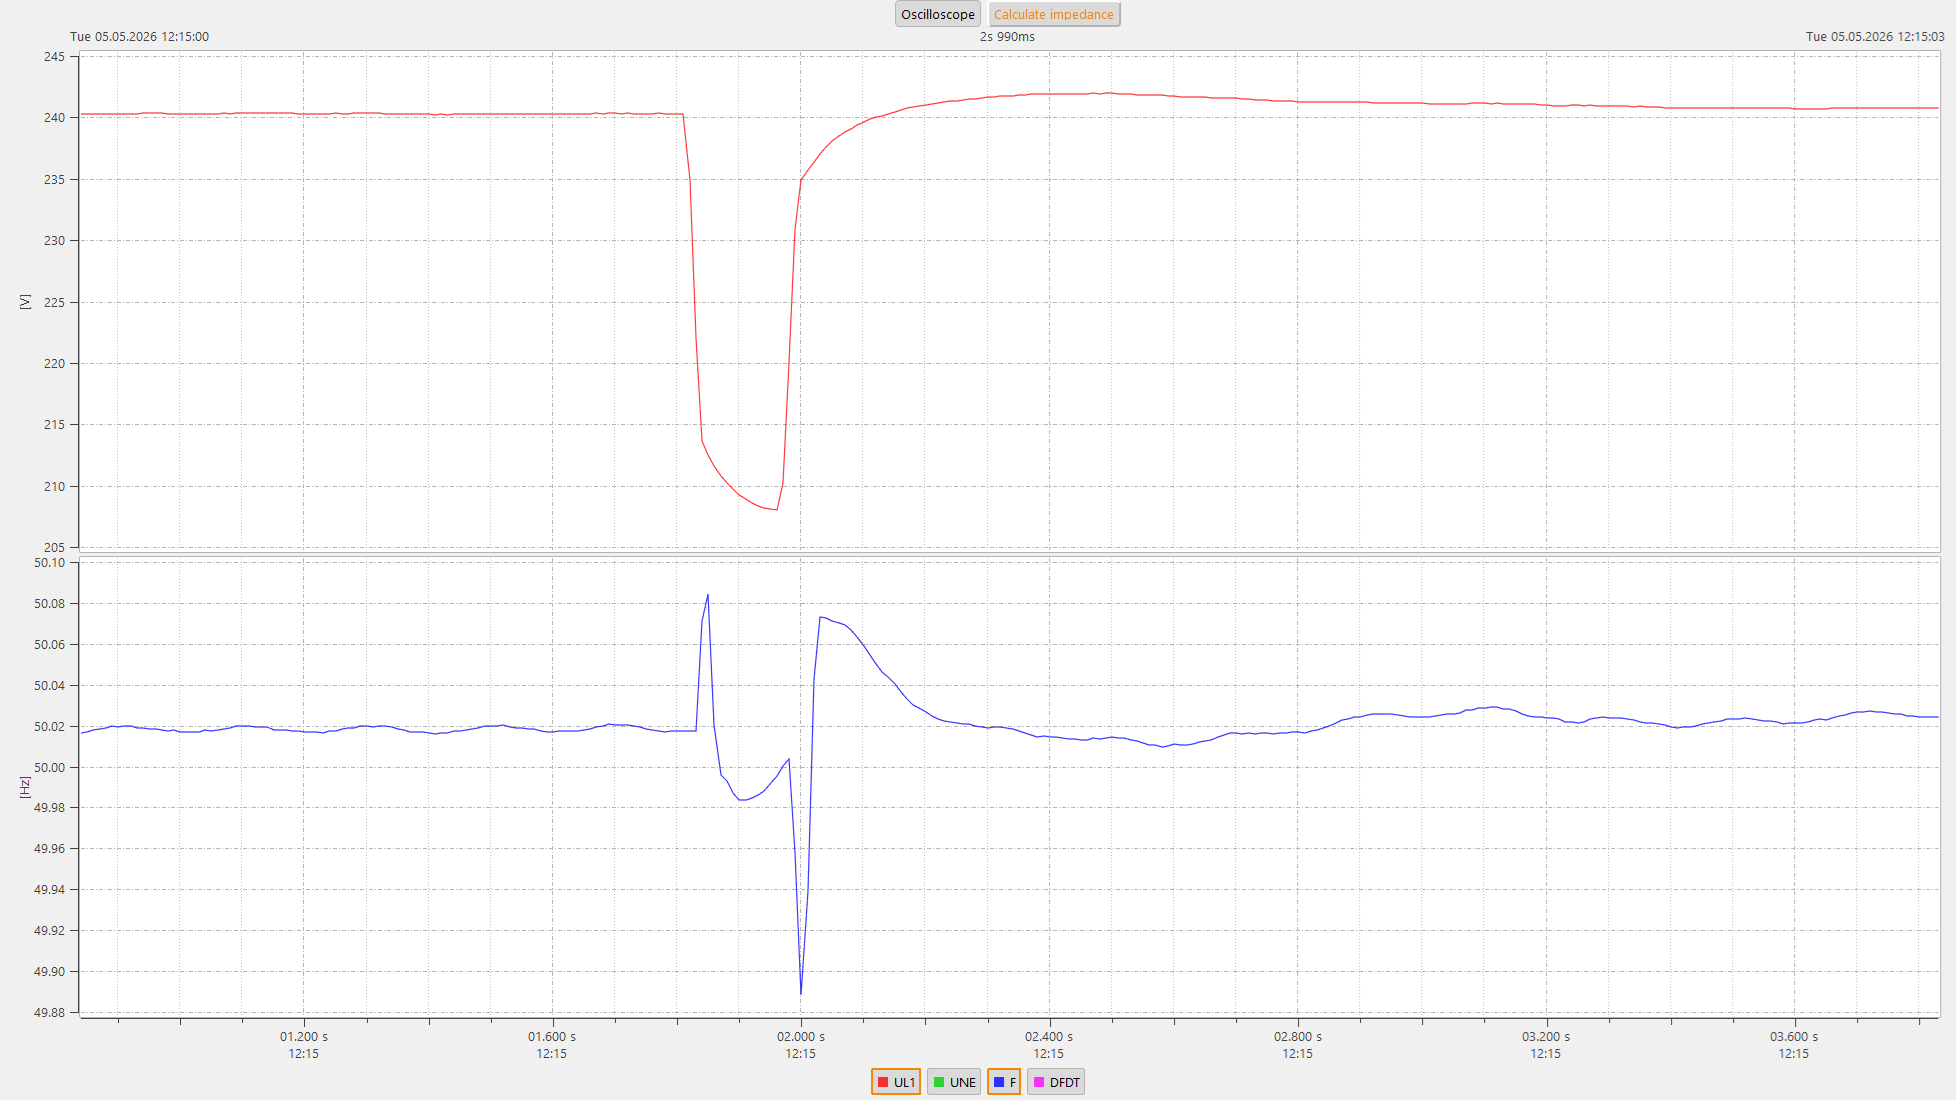
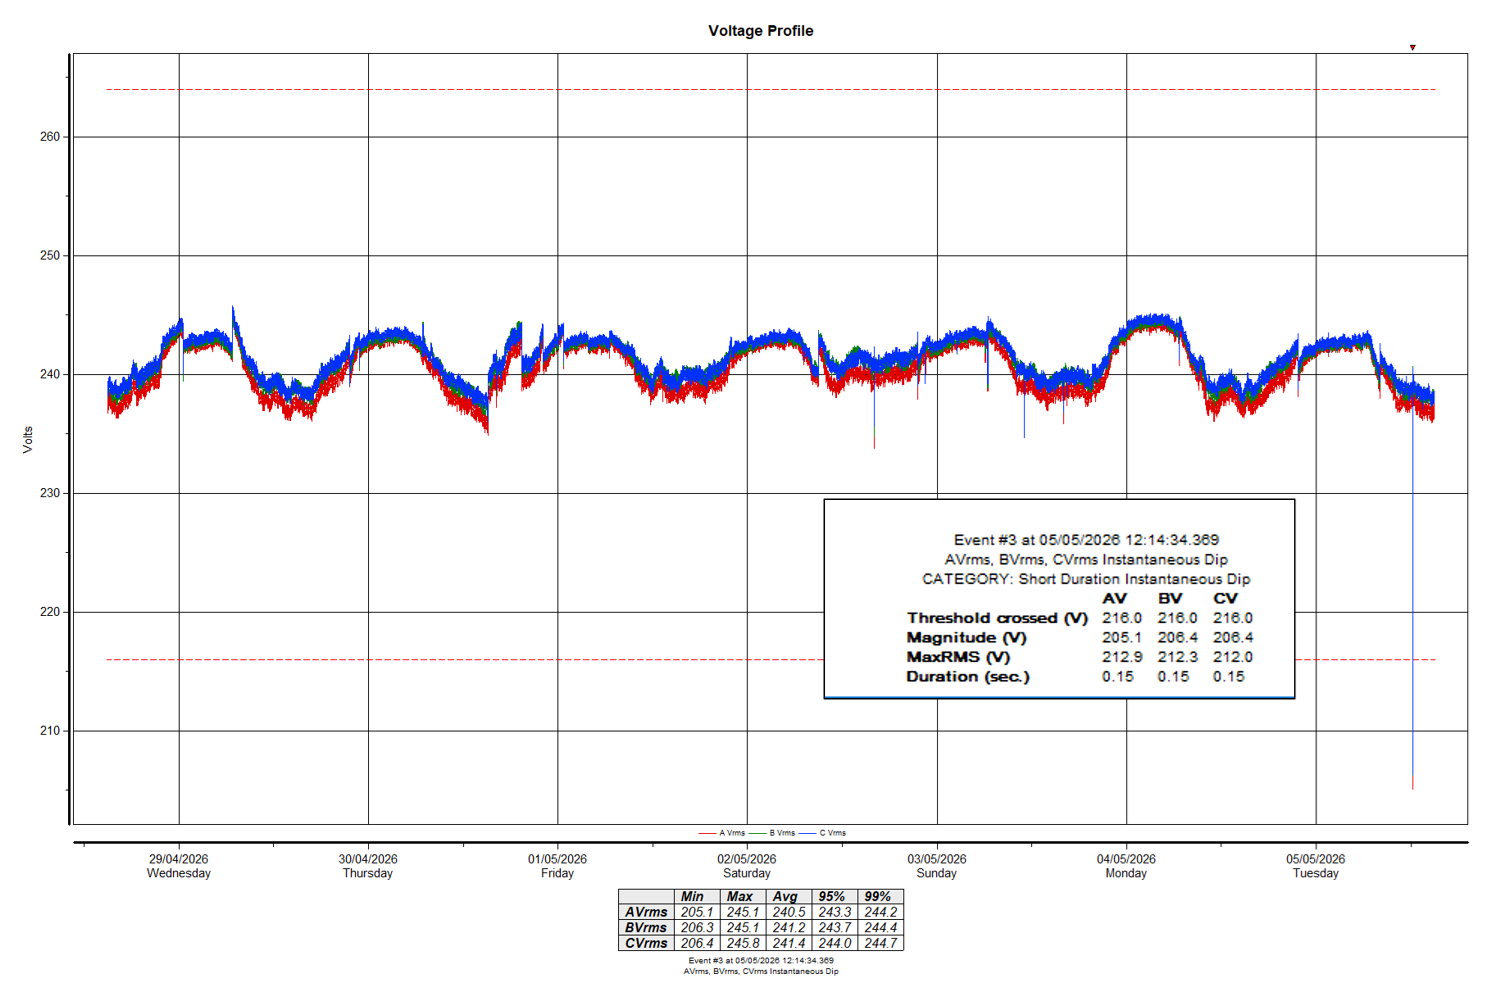
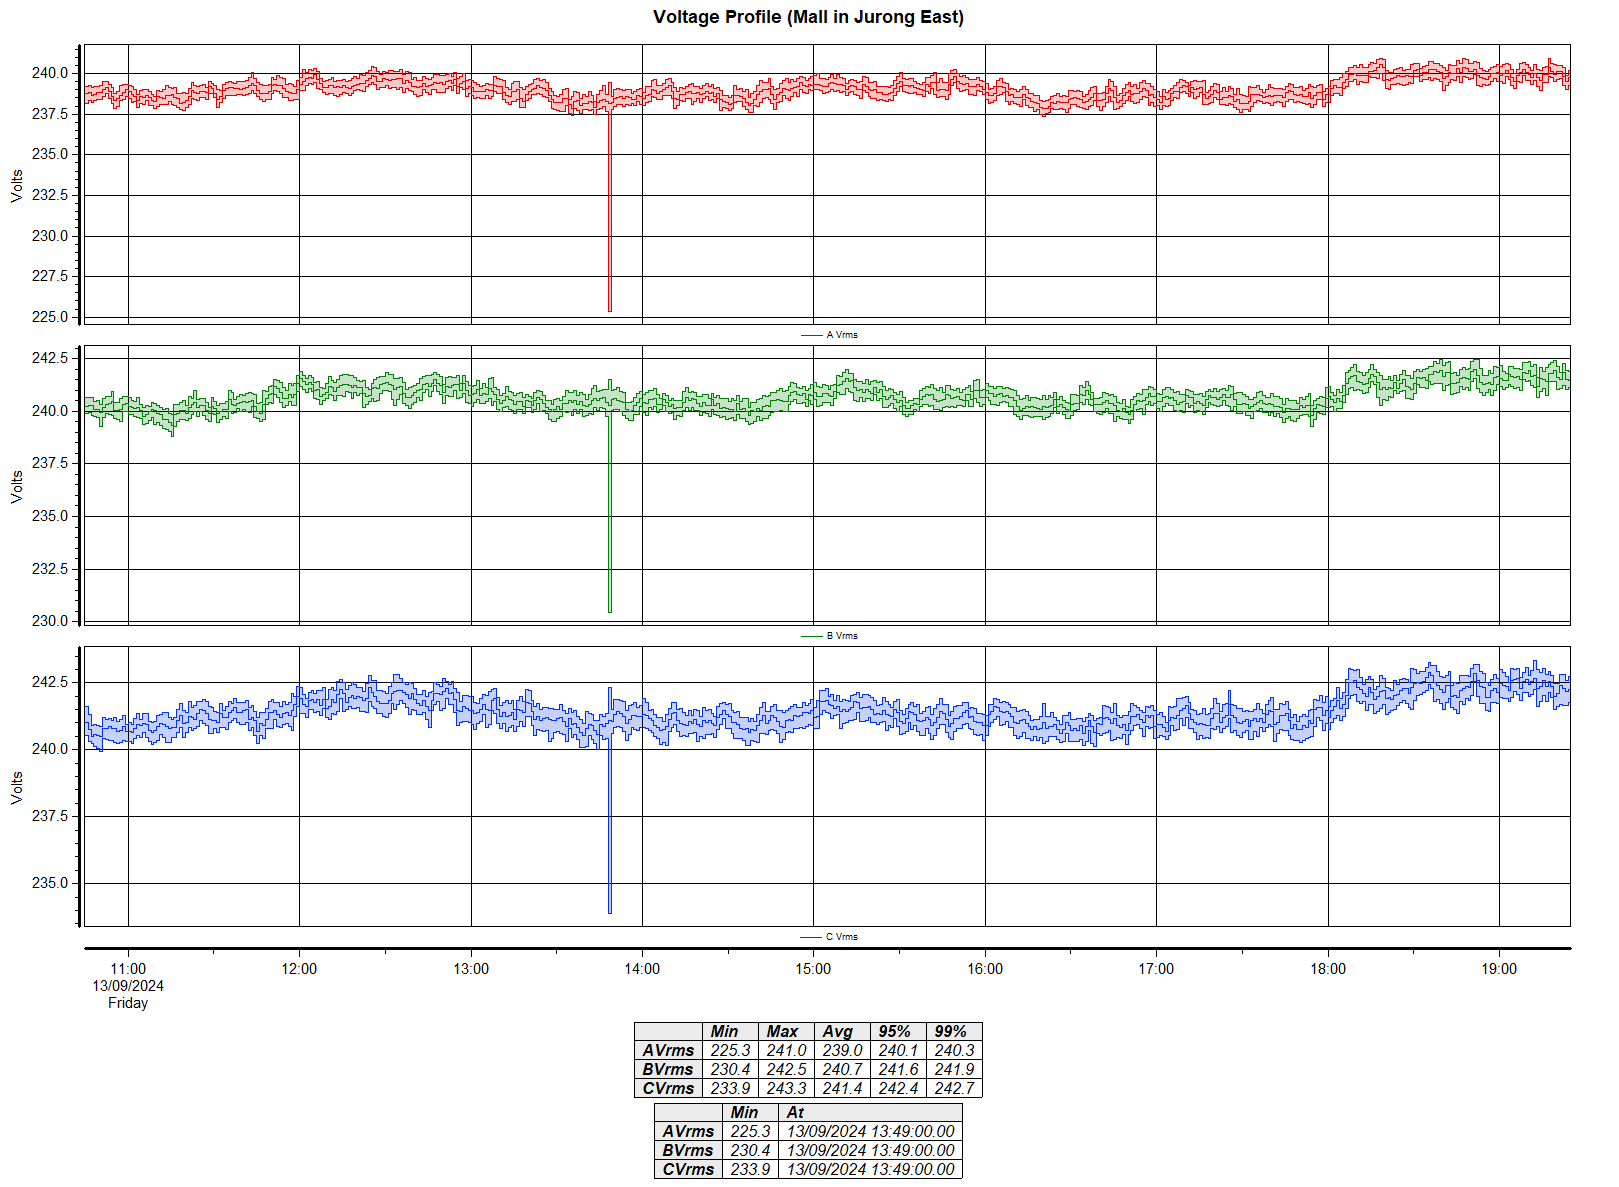
During lunchtime today, a shallow dip was recorded at my home’s PQUBE3 (+ PQ-Box 50) and at a shopping mall in Jurong East.
Considering that it takes at least an 8-minute drive from my home to the mall, it was probably a 3-phase transmission level fault (i.e home and mall do not share the same 22kV distribution network).
Or a high magnitude fault in an adjacent 22kV network to the mall and my home (connected via the 66kV network path).
Home’s PQUBE3PQ-Box 50 (under test – in home office)Voltage Trend at a Mall’s Riser (via Dranetz EP1)
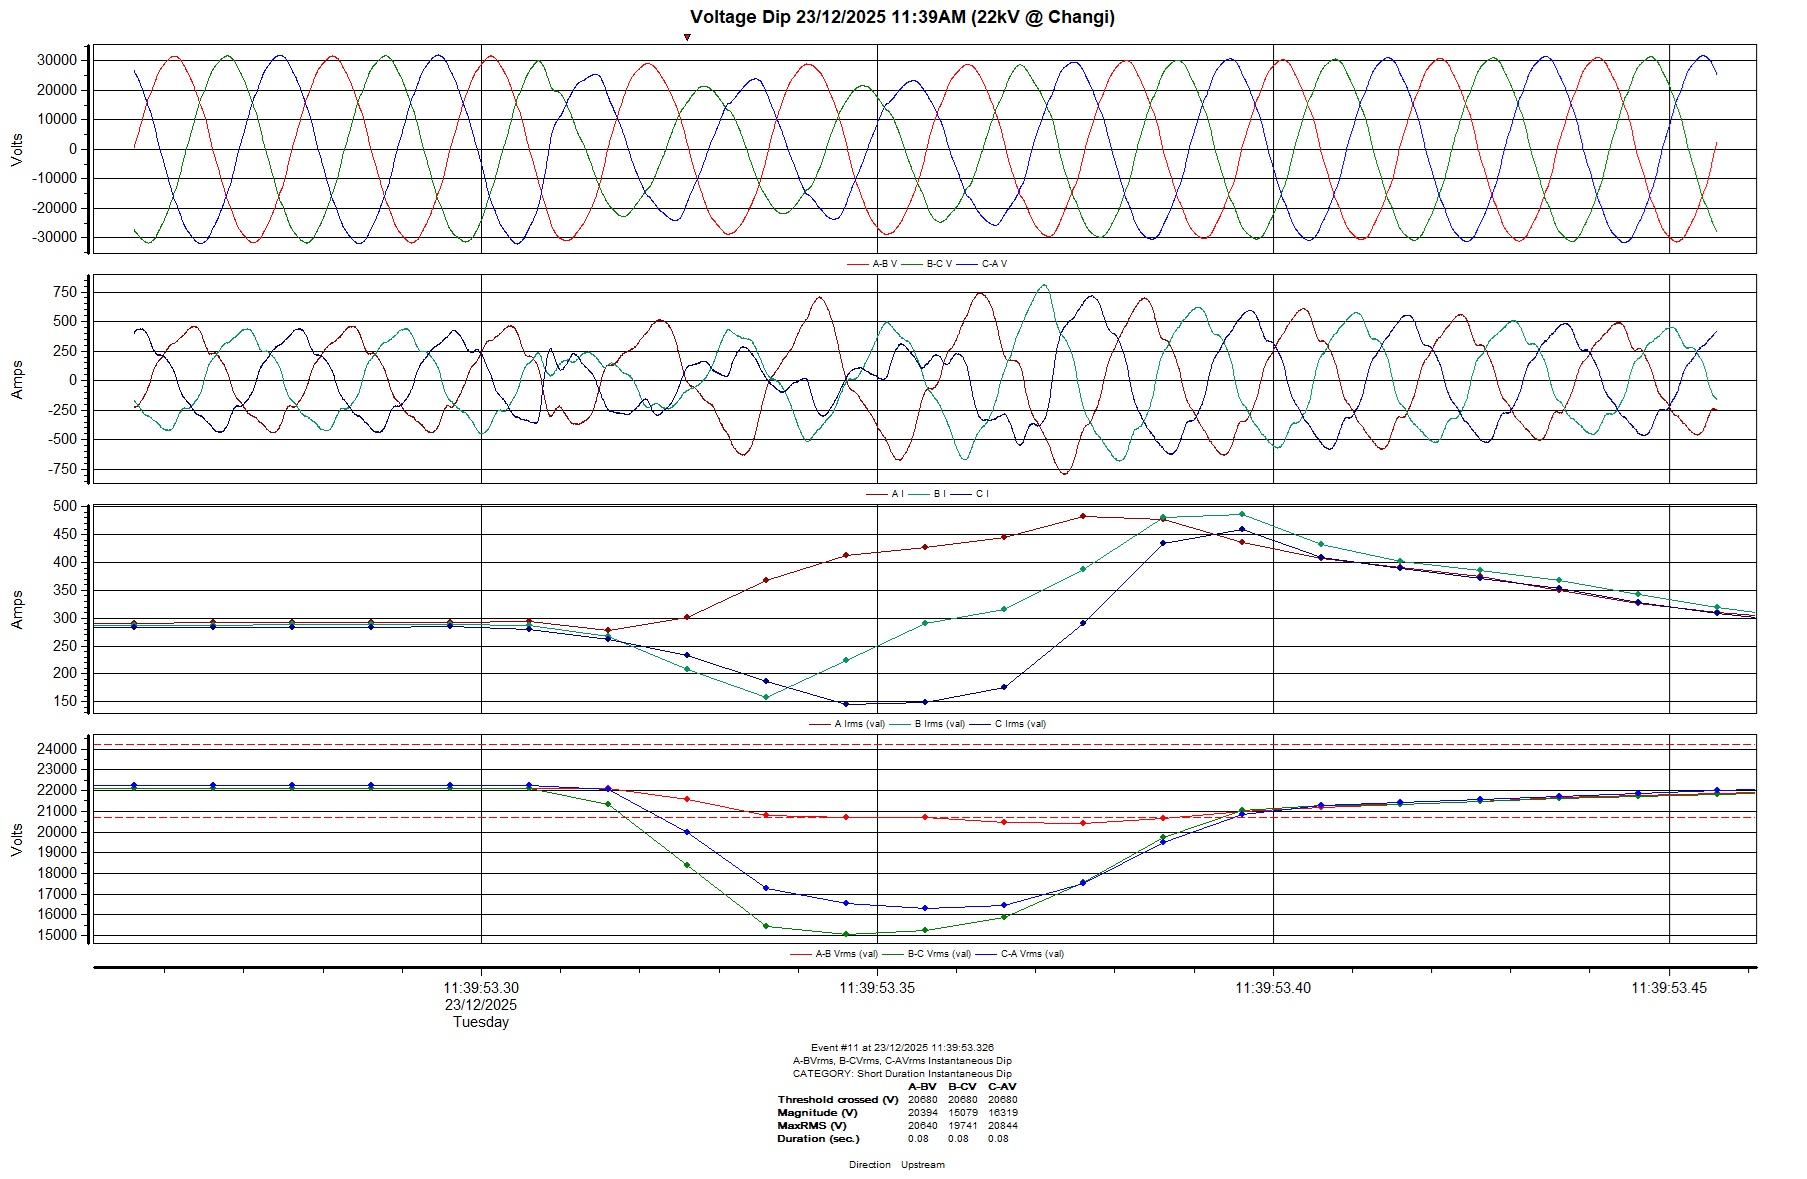
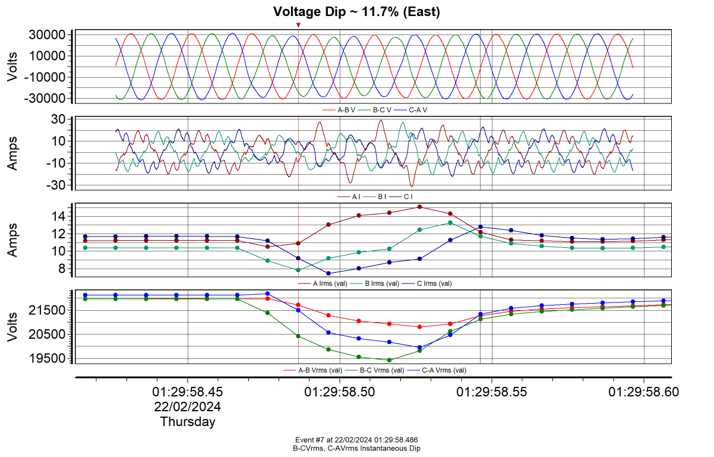
Earlier in the week, on Tuesday 23/12/2025 at approximately 11:39AM, a transmission level fault occurred. The East region (North-East to be exact) was affected the most, with dip-by values in the range of ~ 30%.
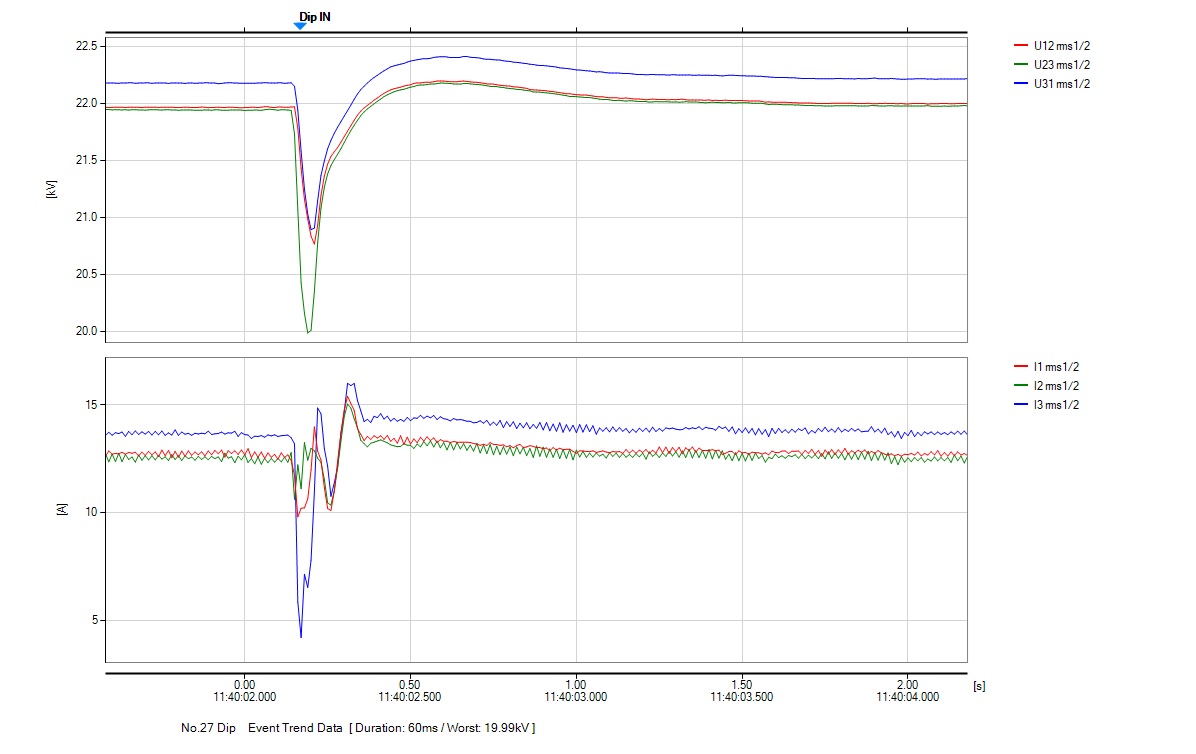
Below were from some our sites in the same affected region at 22kV and LV in Changi and Bedok areas respectively.
When a 230kV fault occurs, a quarter of Singapore will feel the worst dip magnitude (the region where the fault occurs), with the other 3 regions observing shallow voltage dips.
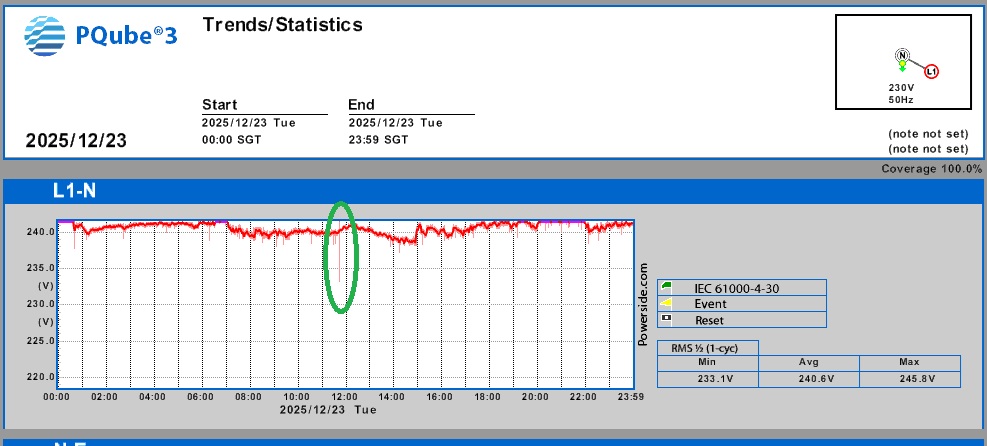
For my home’s PQube3 in the west, it was a non-event, as seen below.
The fault originated from Malaysia’s TNB network (fault on Phase L3).
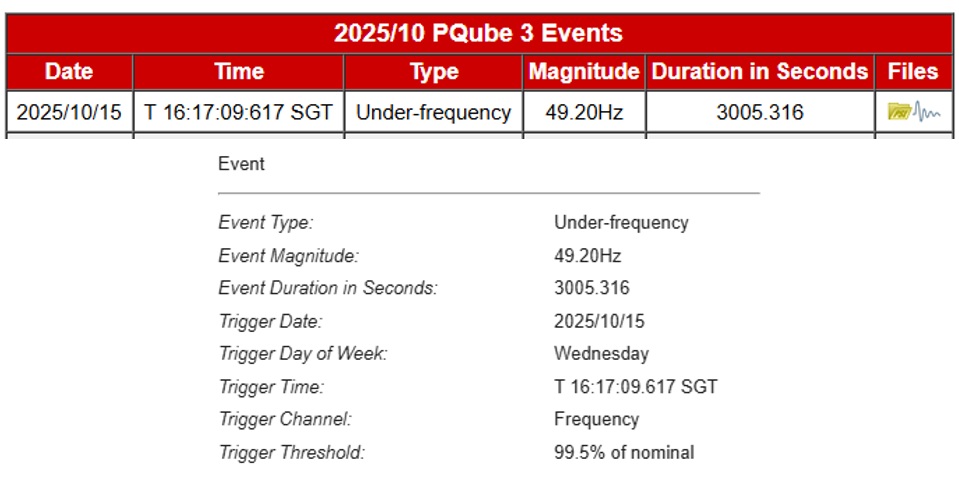
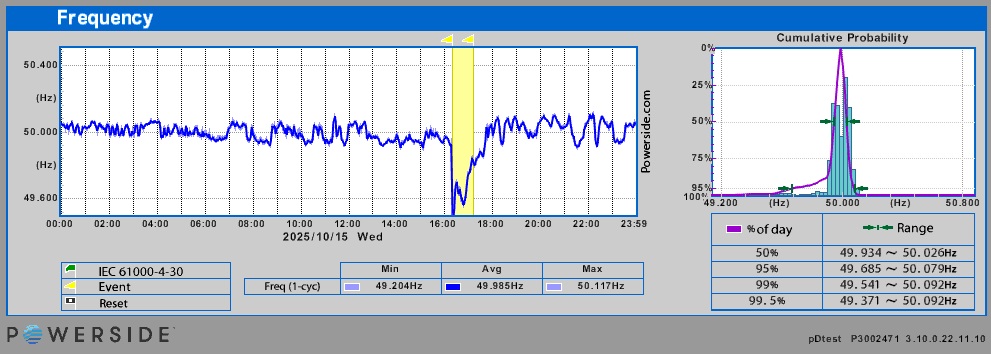
My home’s PQube 3 detected a frequency violation (as low as 49.20Hz) at 4:17PM.
Note: Trigger threshold was set at 49.75Hz. Hence don’t be too alarmed with the duration of 3005 seconds.
Nominal system frequency for Singapore is +/-1% of 50Hz (49.5Hz – 50.5Hz)
Time-line wise, it generally matched the power outage that affected parts of Malaysia’s Klang Valley and Johor Bahru (due to an incident at a power plant in Melaka), as reported by AsiaOne and The EdgeMalaysia.
“The outage at Edra Melaka Power Plant, owned by independent power producer Edra Power Holdings Sdn Bhd, took out supply capacity equivalent to over 10% of Peninsular Malaysia’s maximum electricity demand and resulted in blackouts across Kepong, Kuala Lumpur and Johor Bahru for more than an hour” – TheEdgeMalaysia
Singapore is connected to Peninsular Malaysia at 230kV.
In the early days of my career, I found a great misconception among my colleagues that every power-related problem (for instance relay tripping, equipment failure) requires the use of a power quality (PQ) analyzer to solve it.
Thus, it became an automatic response. The switchboard tripped -> hook up a PQ analyzer. And this occurred for most times without even understanding what the problem was. And for most if not all of these occasions, no real conclusion was formed from the PQ analyzer’s data.
Lesson to Be Learnt: Hooking up a PQ analyzer without understanding the problem can never lead to any useful results.
Here’s a case (occurred a year ago) where it just required a good engineering sense to solve the problem.
Background
Old shopping mall in the western part of Singapore.
Original design of its main switchboard(s) – has one transformer source per MSB only, with no options to couple to another source.
MSB Incoming Air Circuit Breaker (ACB) – was assumed to be 4P or TPN (three-pole breaker with a switched neutral).
New ‘coupler-boards’ were installed to allow coupling of loads of two switchboards to one source (eg. Transformer 4 ‘Off’ – all loads on Transformer 4 will be tied onto Transformer 5 – for instance during maintenance or replacement works on Transformer 4)
Coupler boards’ ACBs were 4P.
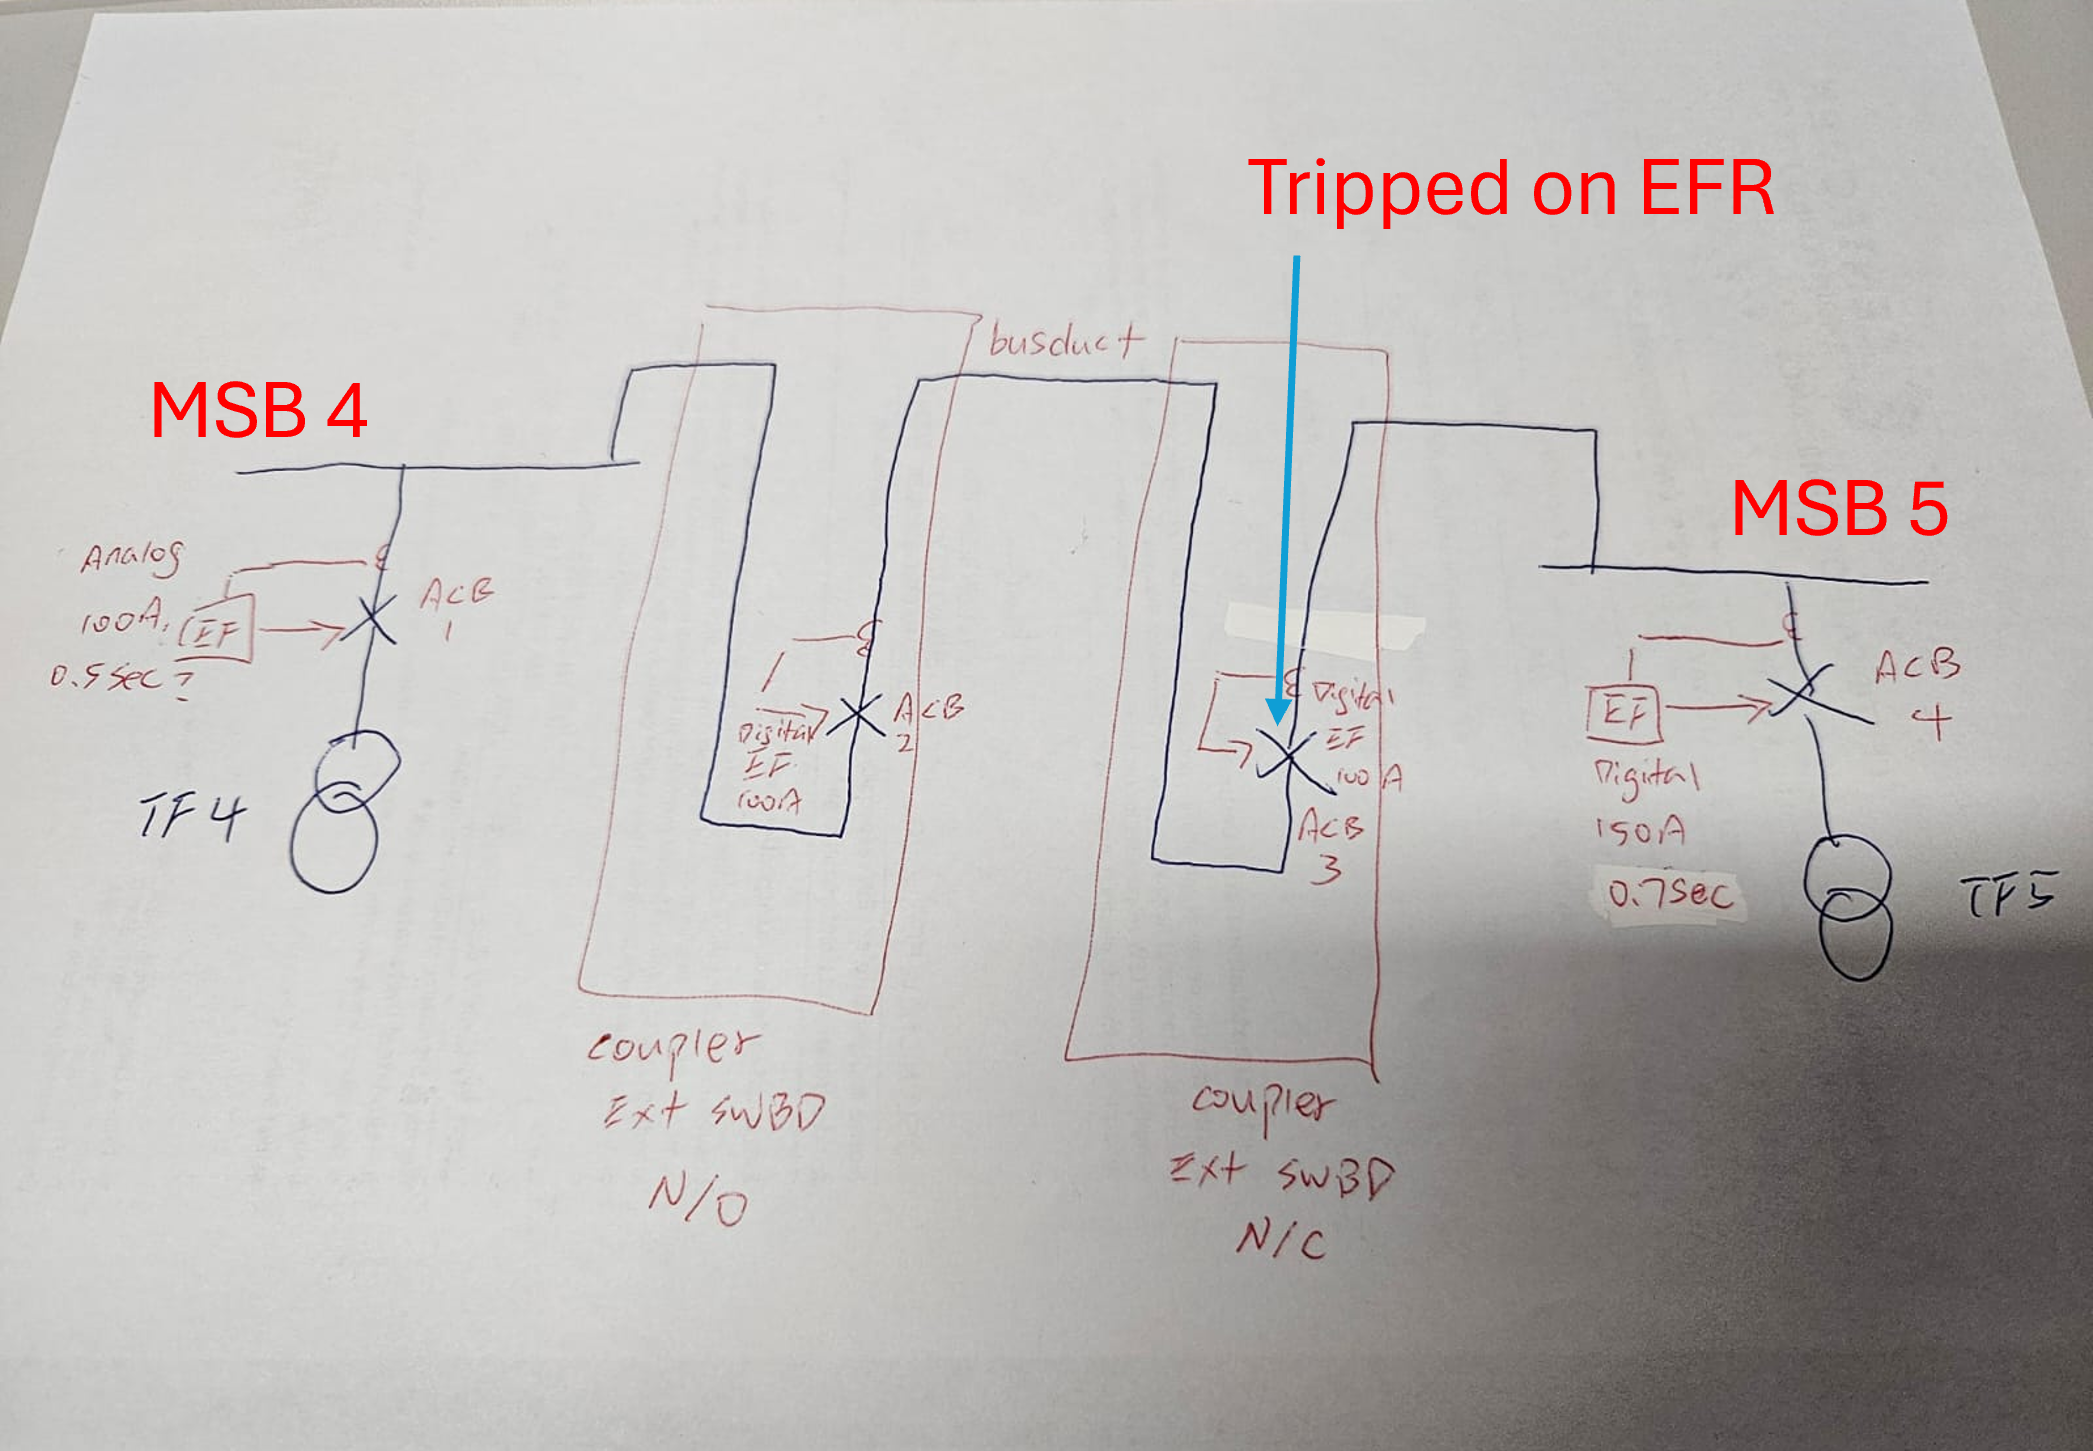
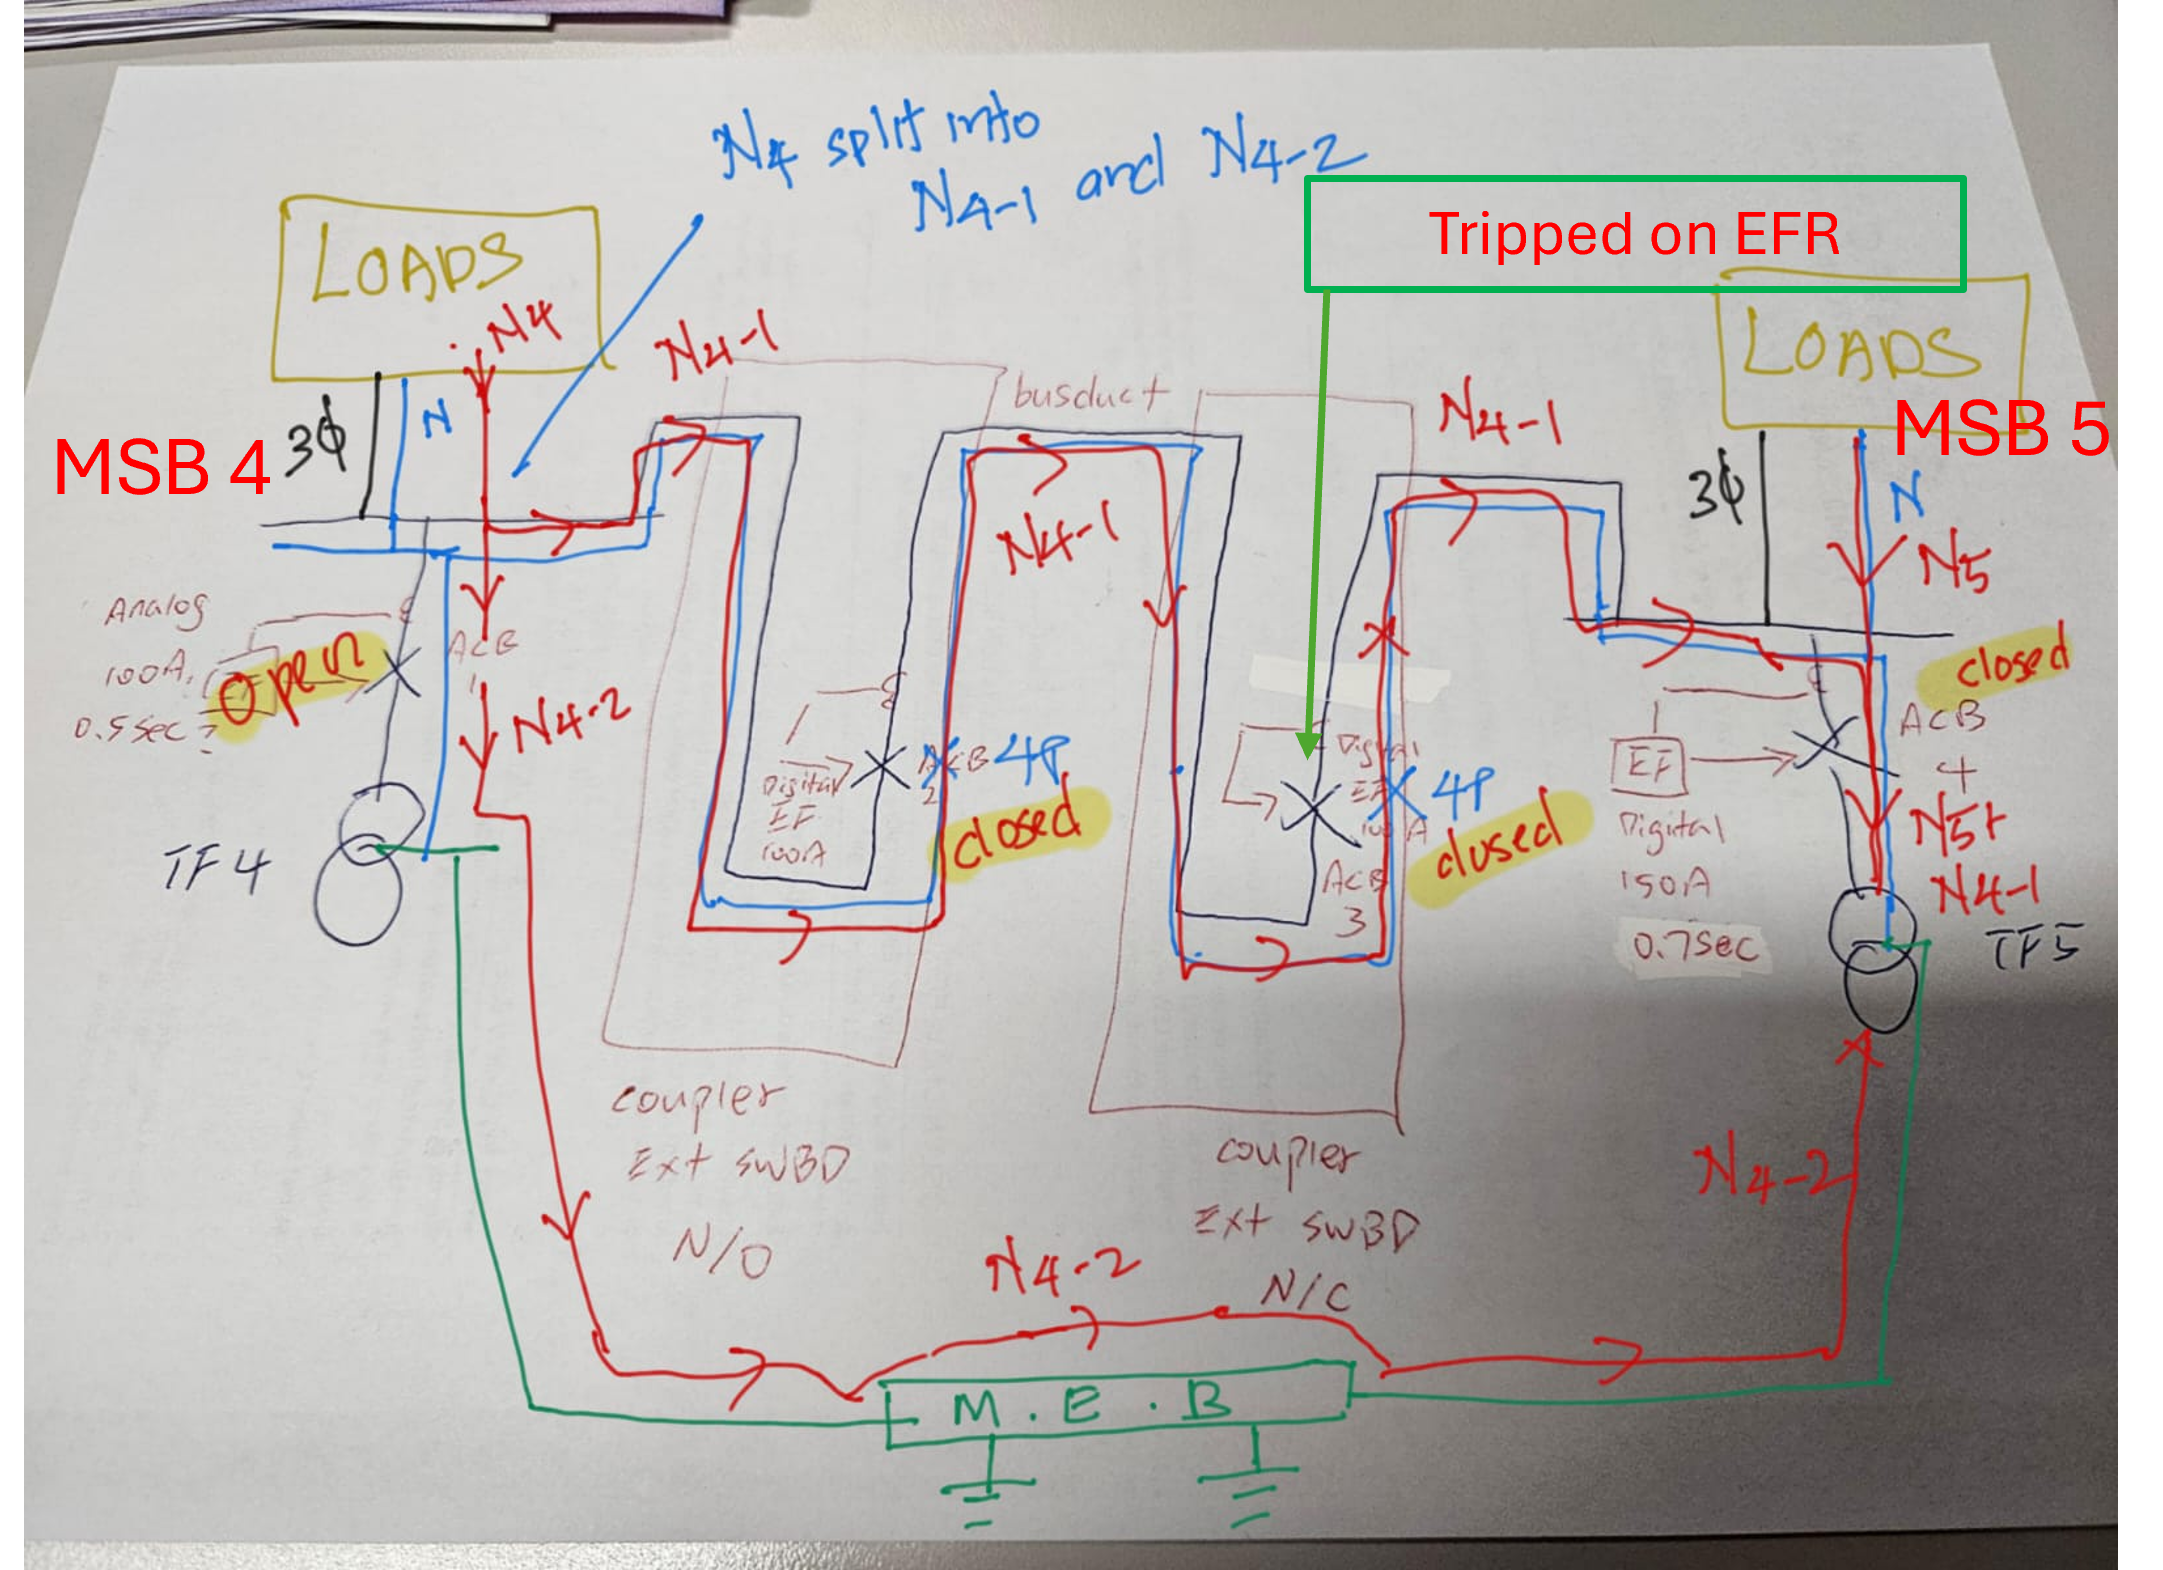
The Incident
Transformer 5 – On (ACB 4 = Close).
Transformer 4 – Off (ACB 1 = Open).
ACB 2 & 3 = Close.
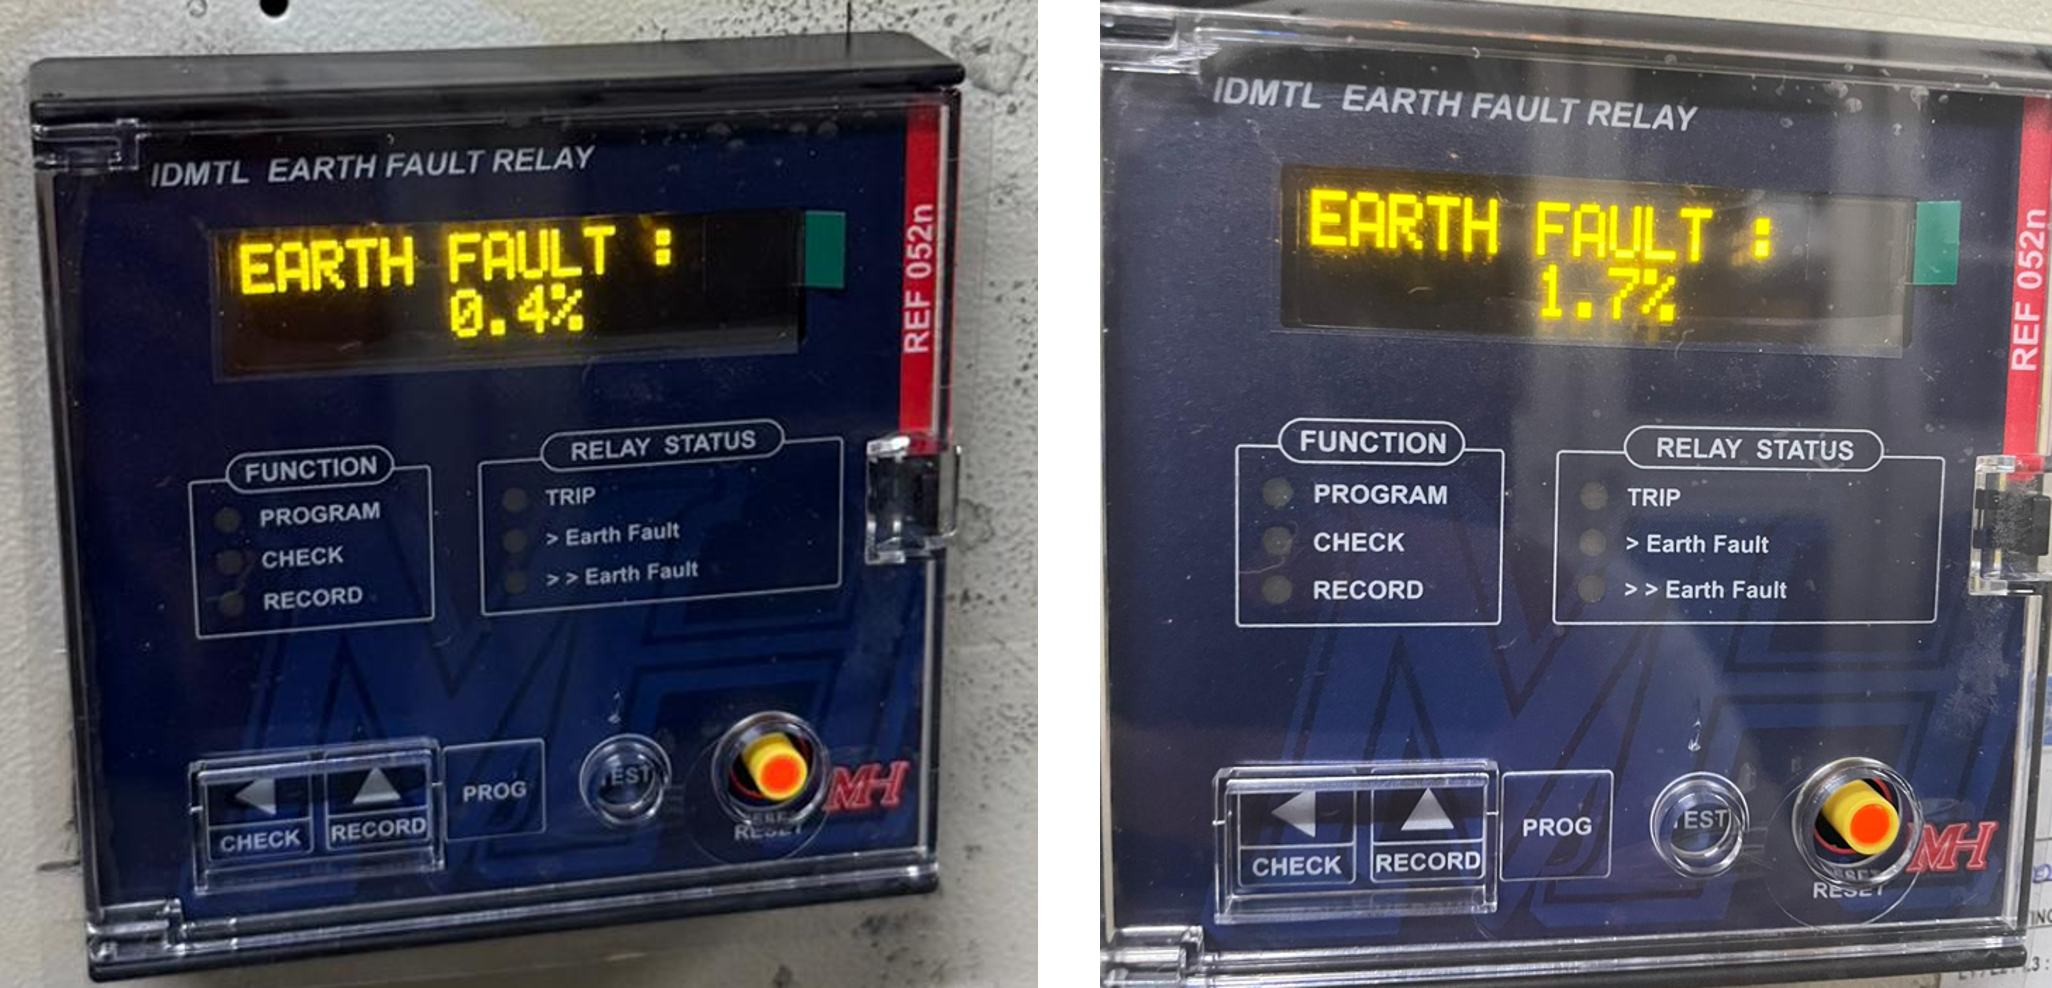
Earth fault relay at MSB 5 (Transformer 5) was observed to ‘rise’ from 0.2% to 1.2% – 1.8%.
No trip observed (all switching works were done outside mall’s operational hours).
Eventually, as the shopping mall started operations and loads picked up – ACB 3 was tripped via the earth fault relay.
No clear fault was found.
The two switchboards were decoupled. Transformer 4 was turned on (normalized to default configuration).
Operations were resumed without further incident.
So, what caused the trip?
Shopping mall’s loads are generally single-phase loads. So, current unbalance is to be expected. This will cause some appreciable current in the neutral phase.
In today’s context, all single-phase loads are electronic loads; high 3rd current harmonic component is to be expected. This further loads up the neutral phase.
The biggest clue for this incident was that the relay’s ‘earth-fault’ value steadily increased as the mall’s loads picked up.
My initial suspicion was that the MSB ACB isn’t 4P or TPN – rather, it was a three-pole ACB with a neutral link (meaning its neutral isn’t isolated when the ACB is OFF).
This caused the neutral current from the loads at MSB 4 to split up (N4 = N4-1 + N4-2).
Thus, the earth fault relay will ‘not see’ the return of the ‘full’ neutral current.
Eventually, when the neutral current was high enough, it triggered the earth fault relay at ACB 3.
On-site checks confirmed my suspicion.
Thus, for this coupling (MSB 4 loads to be supplied by MSB 5) to work seamlessly, the neutral link at ACB 1 has to be removed, before being coupled.
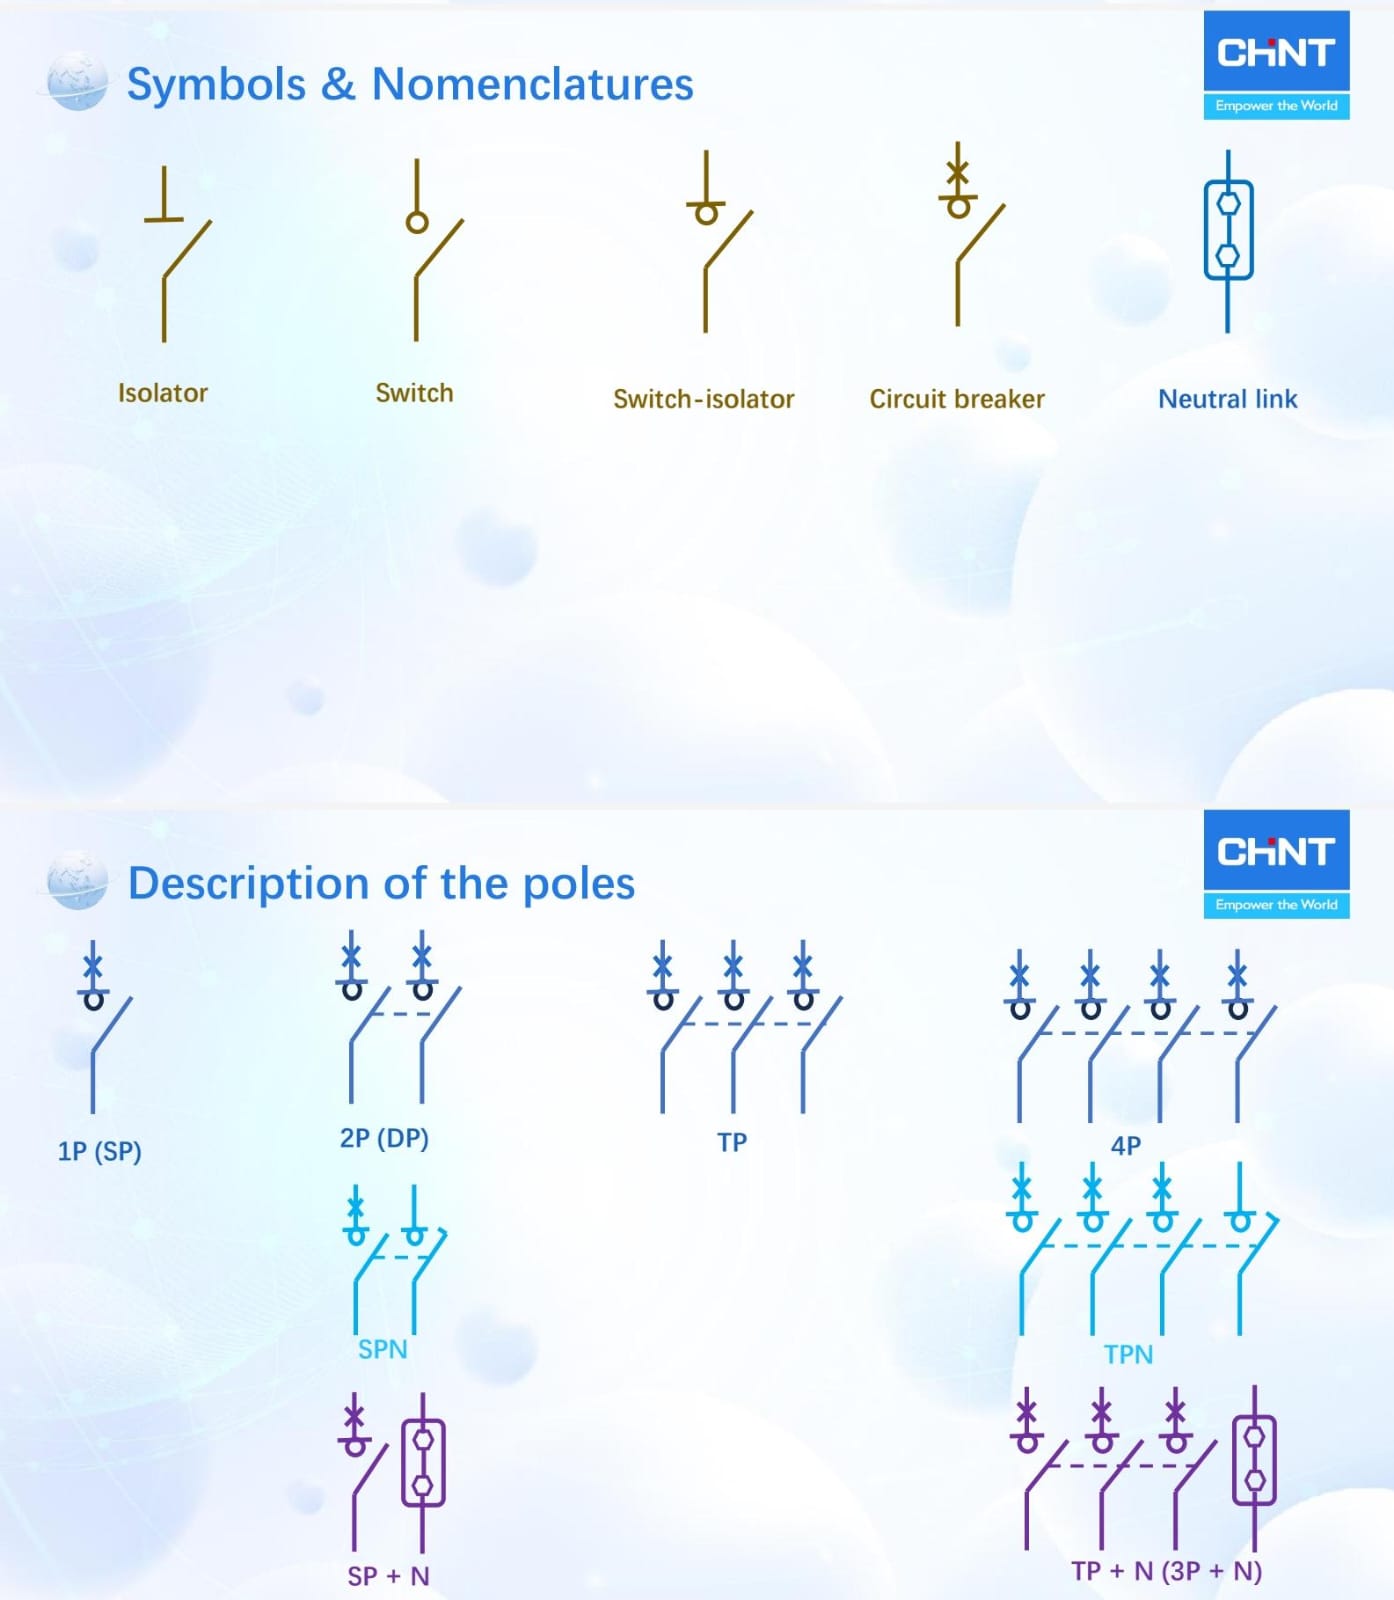
Additionally, in the local scene, “TPN” vs “TP+N” gets frequently mixed up (unfortunately).
Below is a diagram from one of CHINT’s presentations to illustrate the different poles of a circuit breaker.
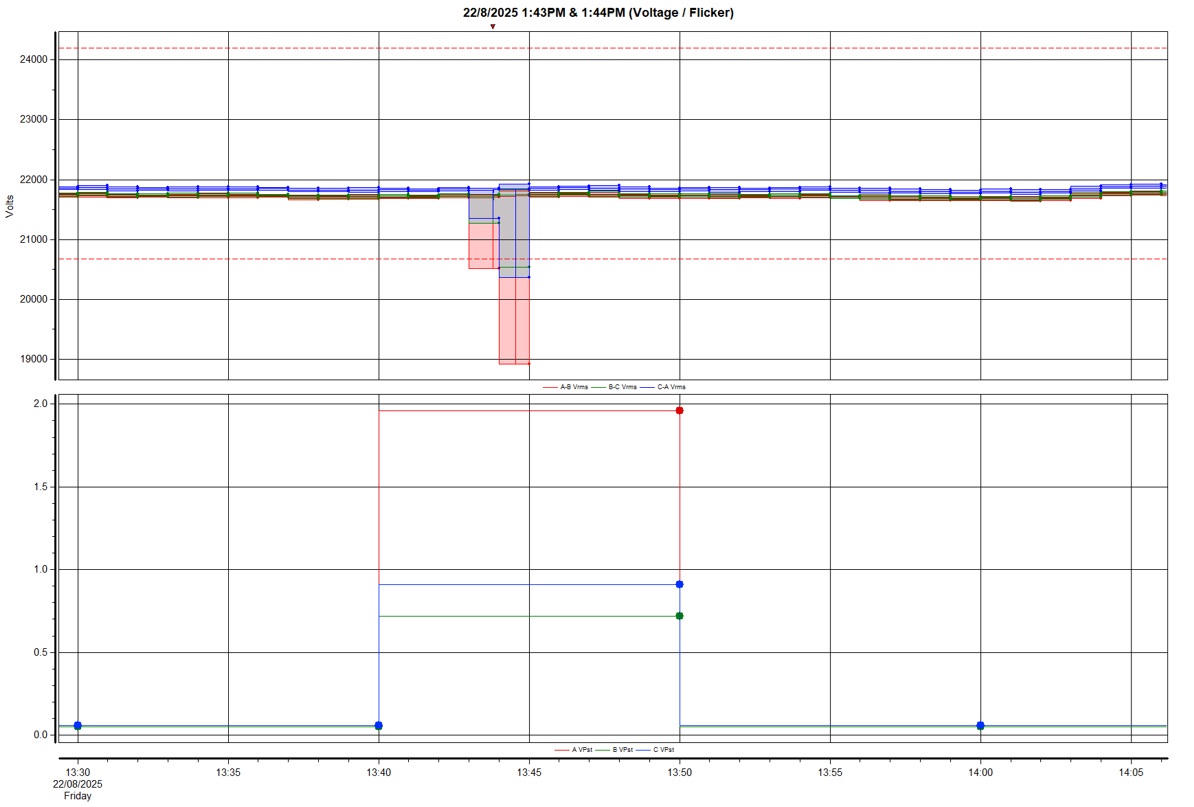
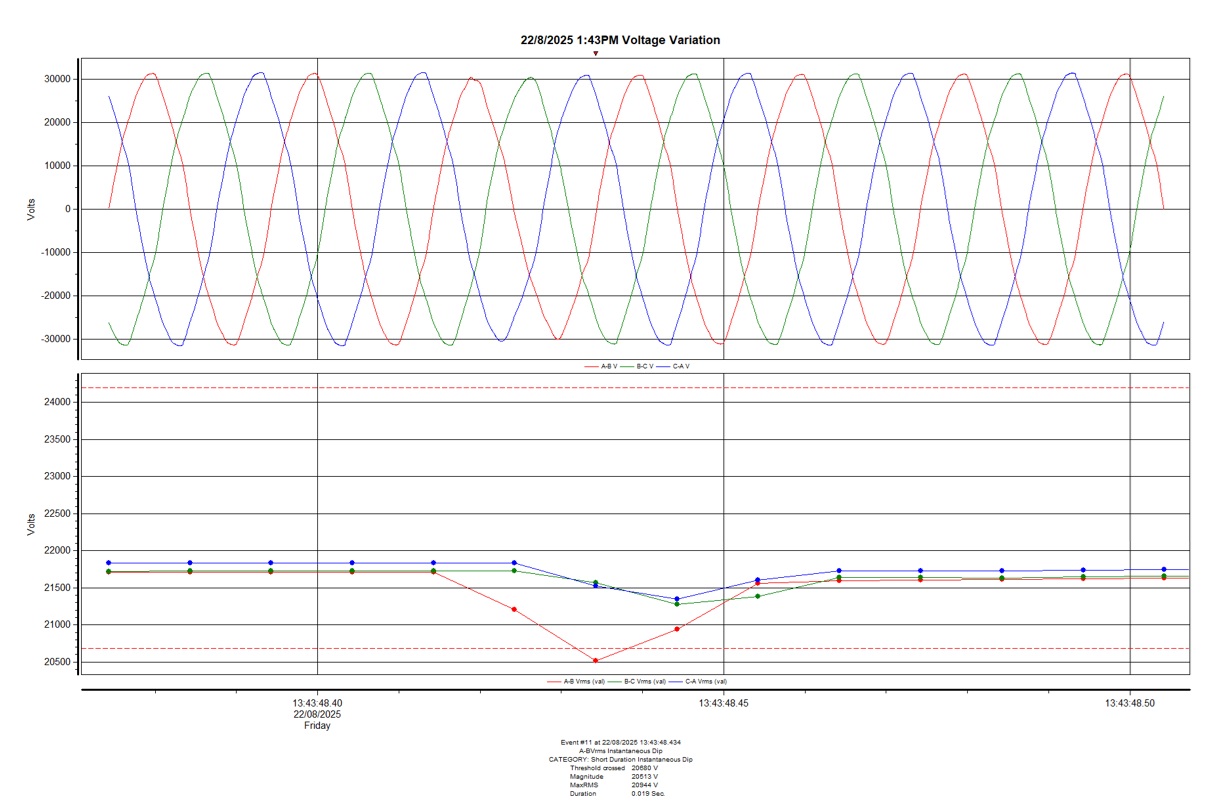
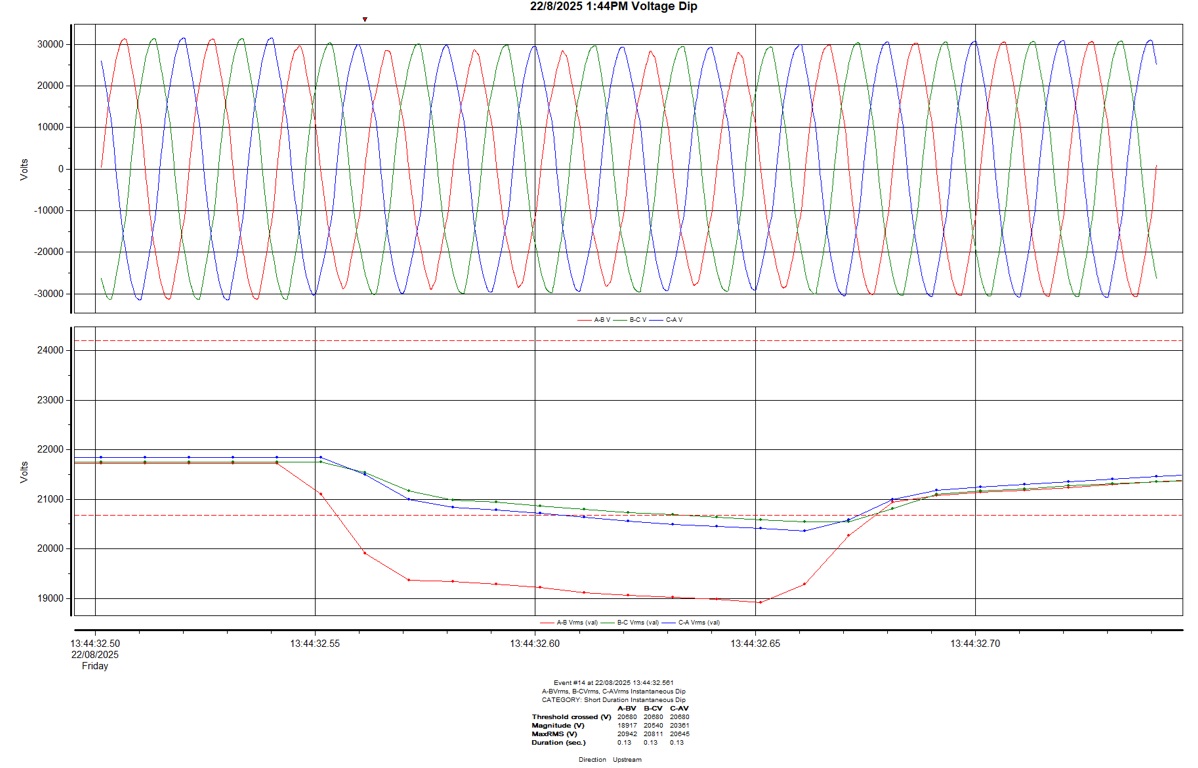
A recent power quality measurement at 22kV recorded a rare occurrence, whereby there were two related events occurring within a minute apart of each other.
Likely, it was due to a fault developing in the first instance (and self-cleared itself), followed by the ‘full-blown’ fault.
We were informed that it was a 22kV cable fault (faulted phases: L1 & L2) on an adjacent distribution network (i.e fault in another 22kV network, ‘connected’ to our measurement point via the 66kV network path).
Course Title: Essentials of Power Quality Monitoring & Analysis. PEB PDU Points = 6.
Objective: This 1-day course aims to provide a good understanding of the fundamental power quality concepts for conducting a proper power quality monitoring and assessment.
What Participants Will Learn: You will learn to identify the various PQ problems, its standards/guidelines and applications. This includes on how to conduct a proper PQ assessment and PQ submission to the local authority.
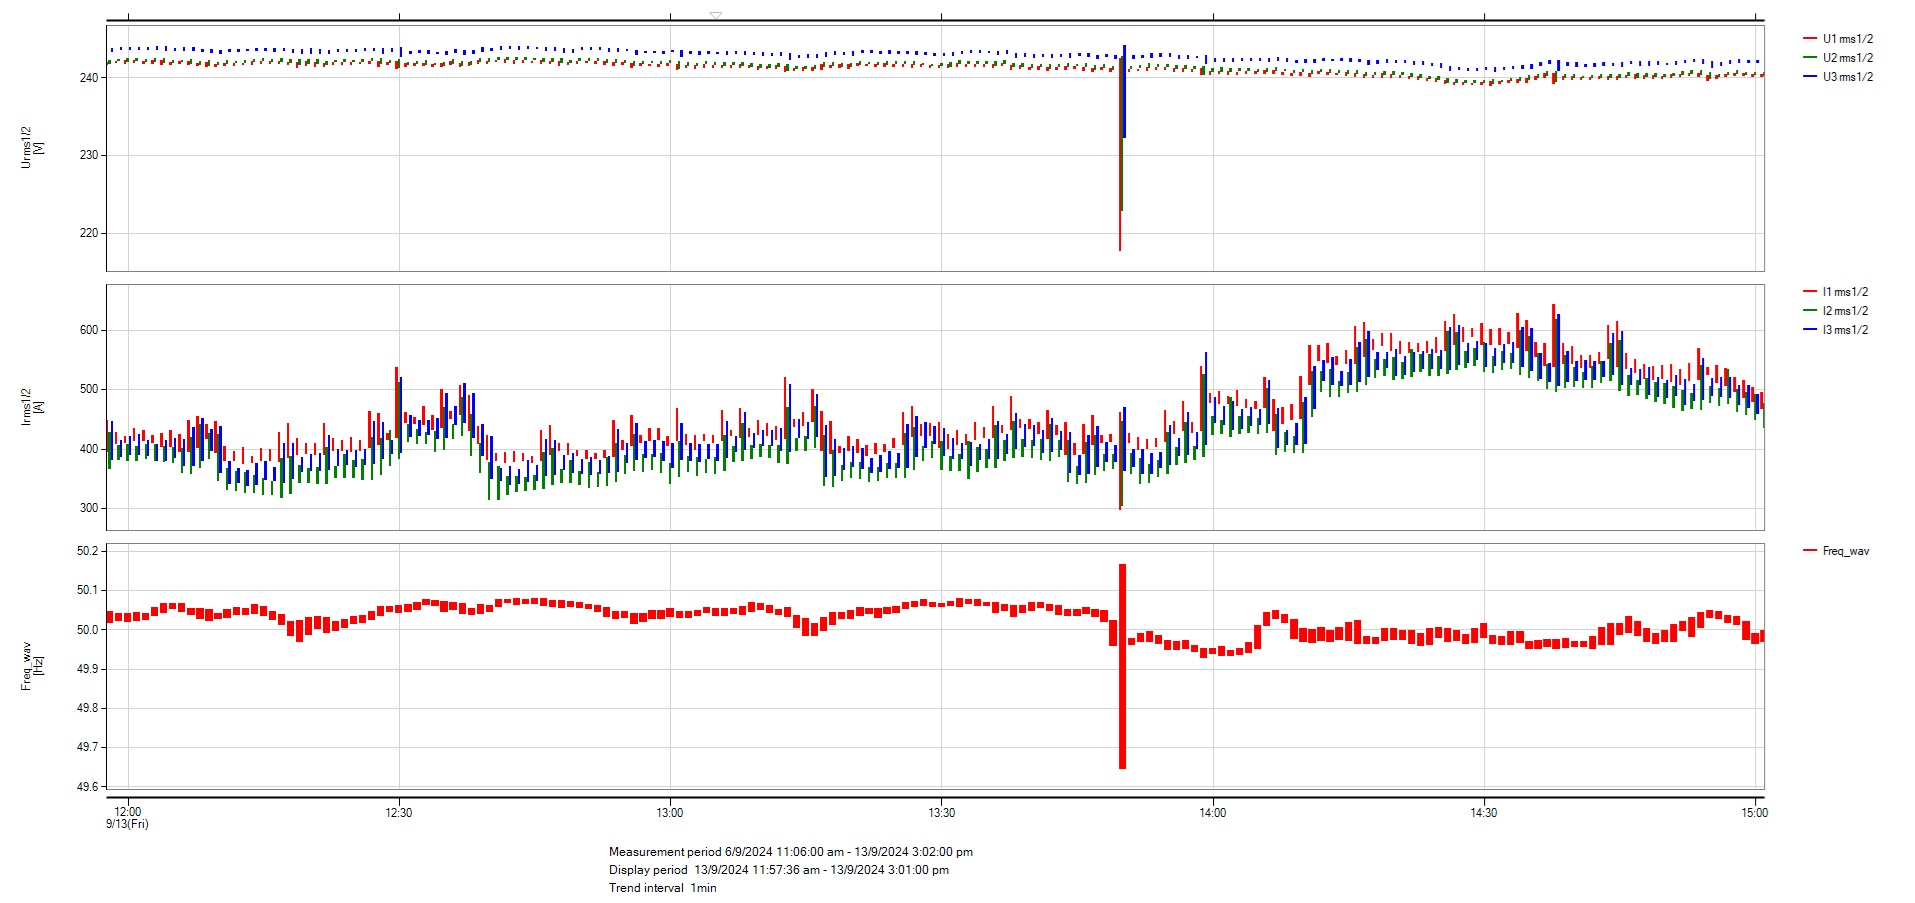
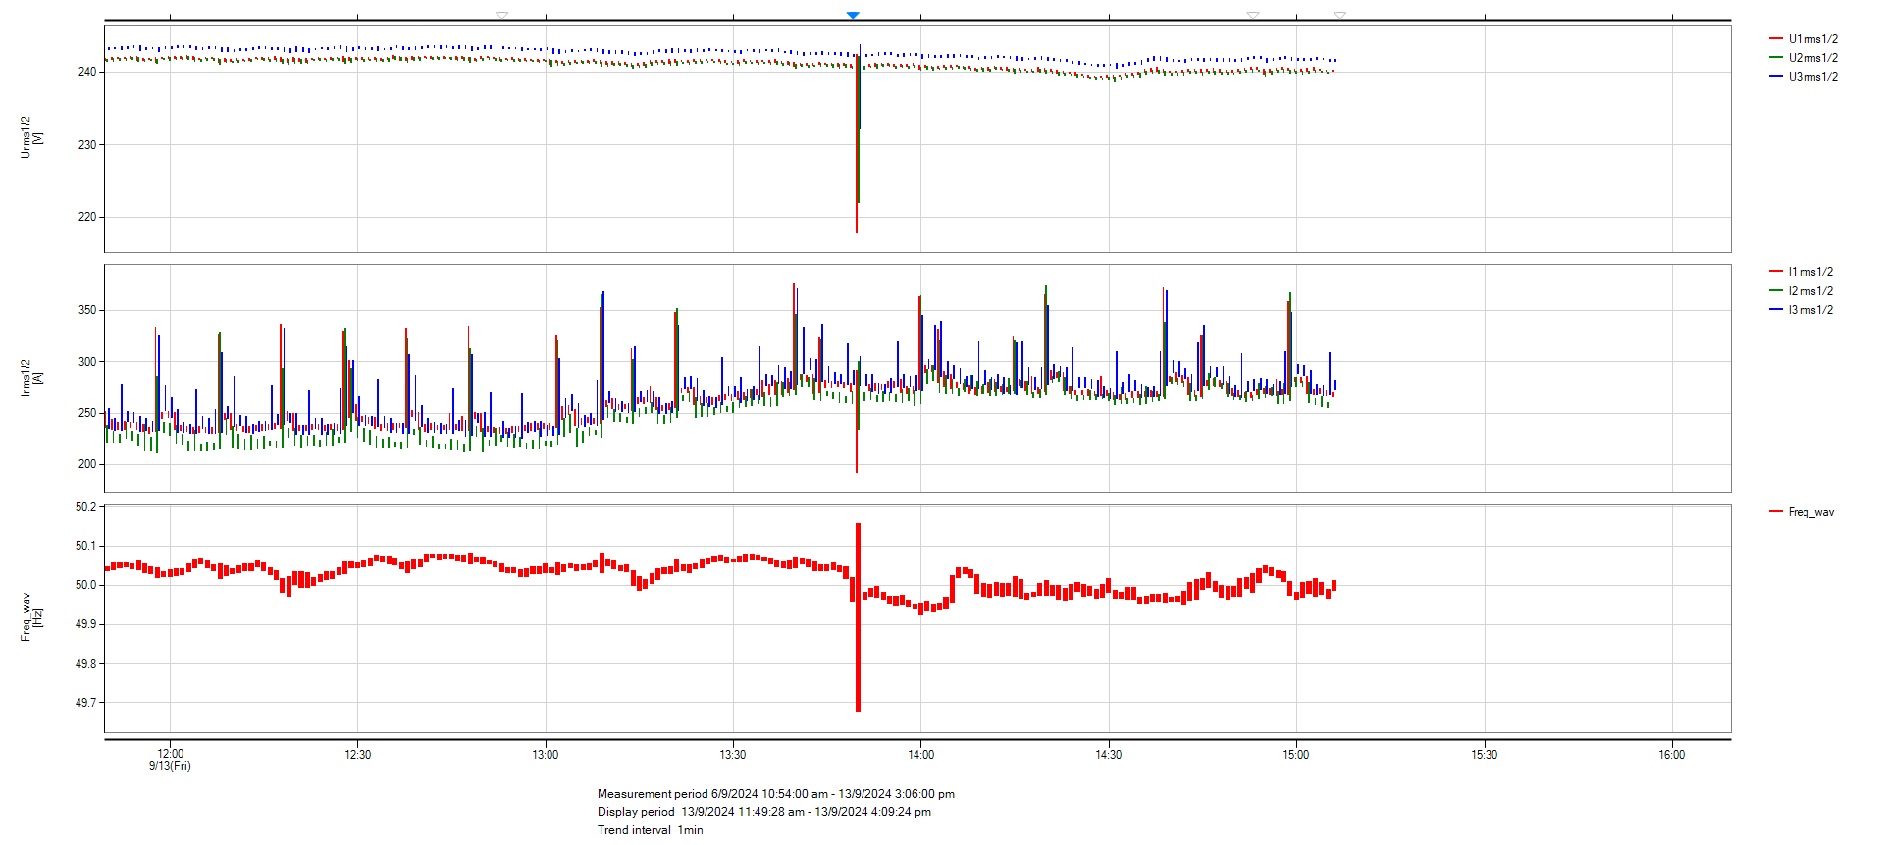
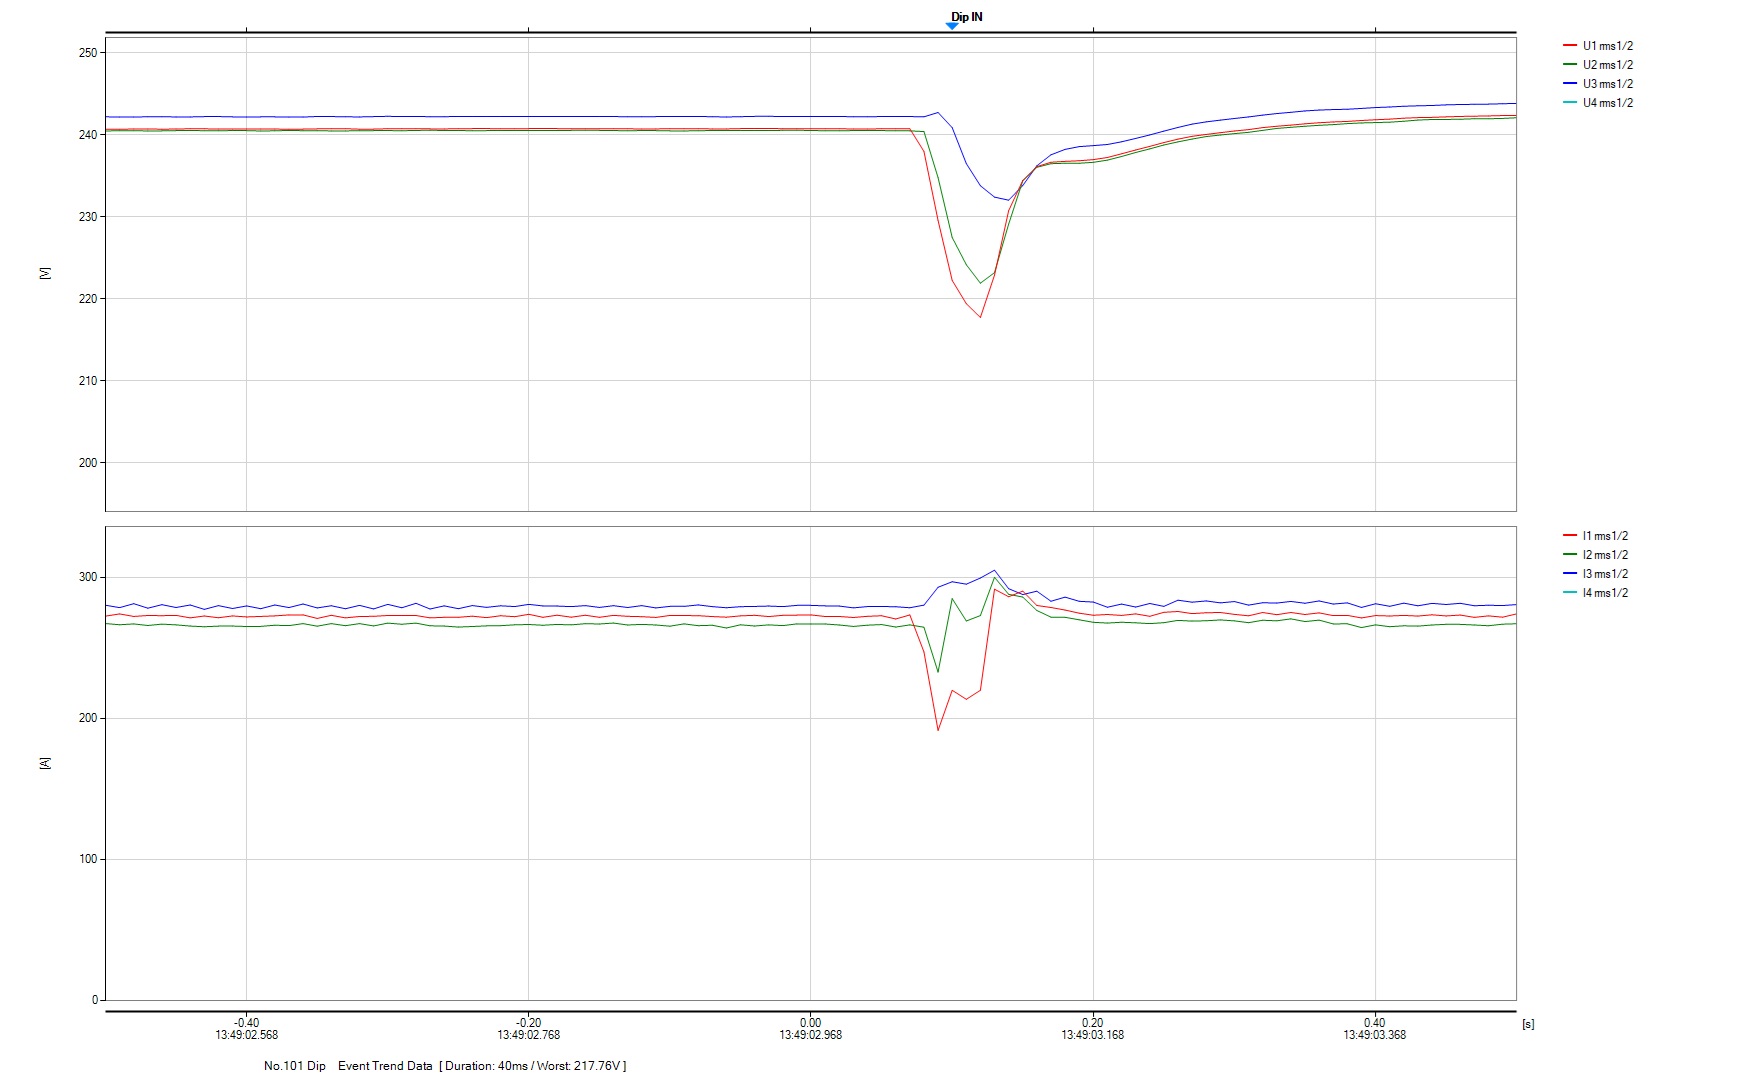
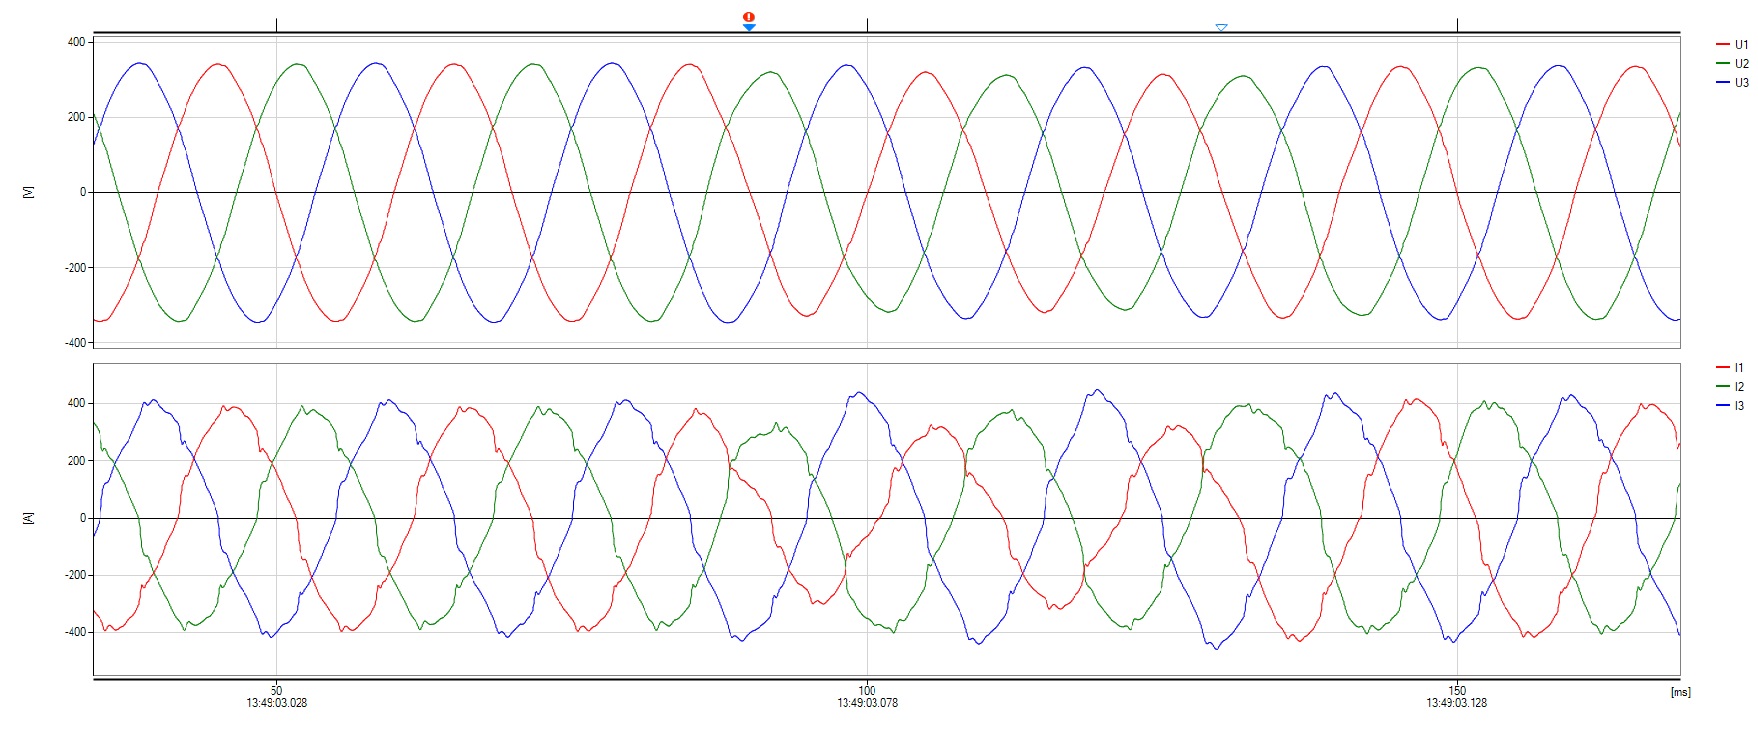
Earlier this afternoon, our portable PQ analyzers (monitoring at Low Voltage) at two different main incomers (in Loyang/Changi) saw a significant drop in voltages.
Technically, not a voltage dip here as the drop was less than 10% of the nominal 230V.
Apparently other parts of Singapore also experienced some form of voltage disturbance (dip or variation), depending on their locations (including my home – which is about 40km away from Loyang/Changi). Thus, confirming this was a transmission level related event.
Update: Due to a 230kV cable fault (single-phase fault on Phase L2) in Jurong Island.
Here are just some trends and a waveform of the event that was captured by our portable PQ analyzers.
At LV PG Incomer 1At LV PG Incomer 2
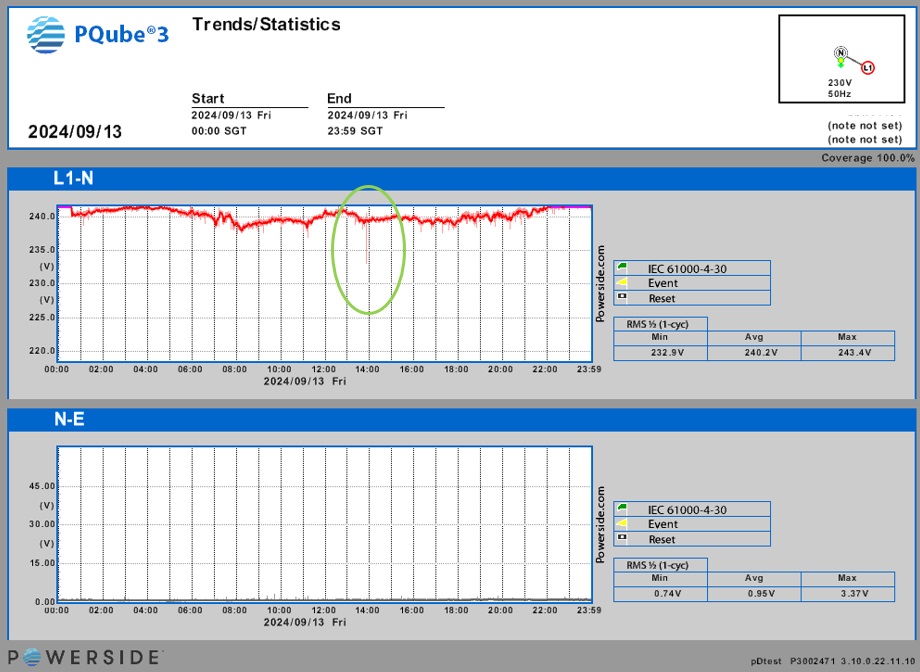
And the voltage trend from my home’s PQUBE3,
Updated 20/9/2024:
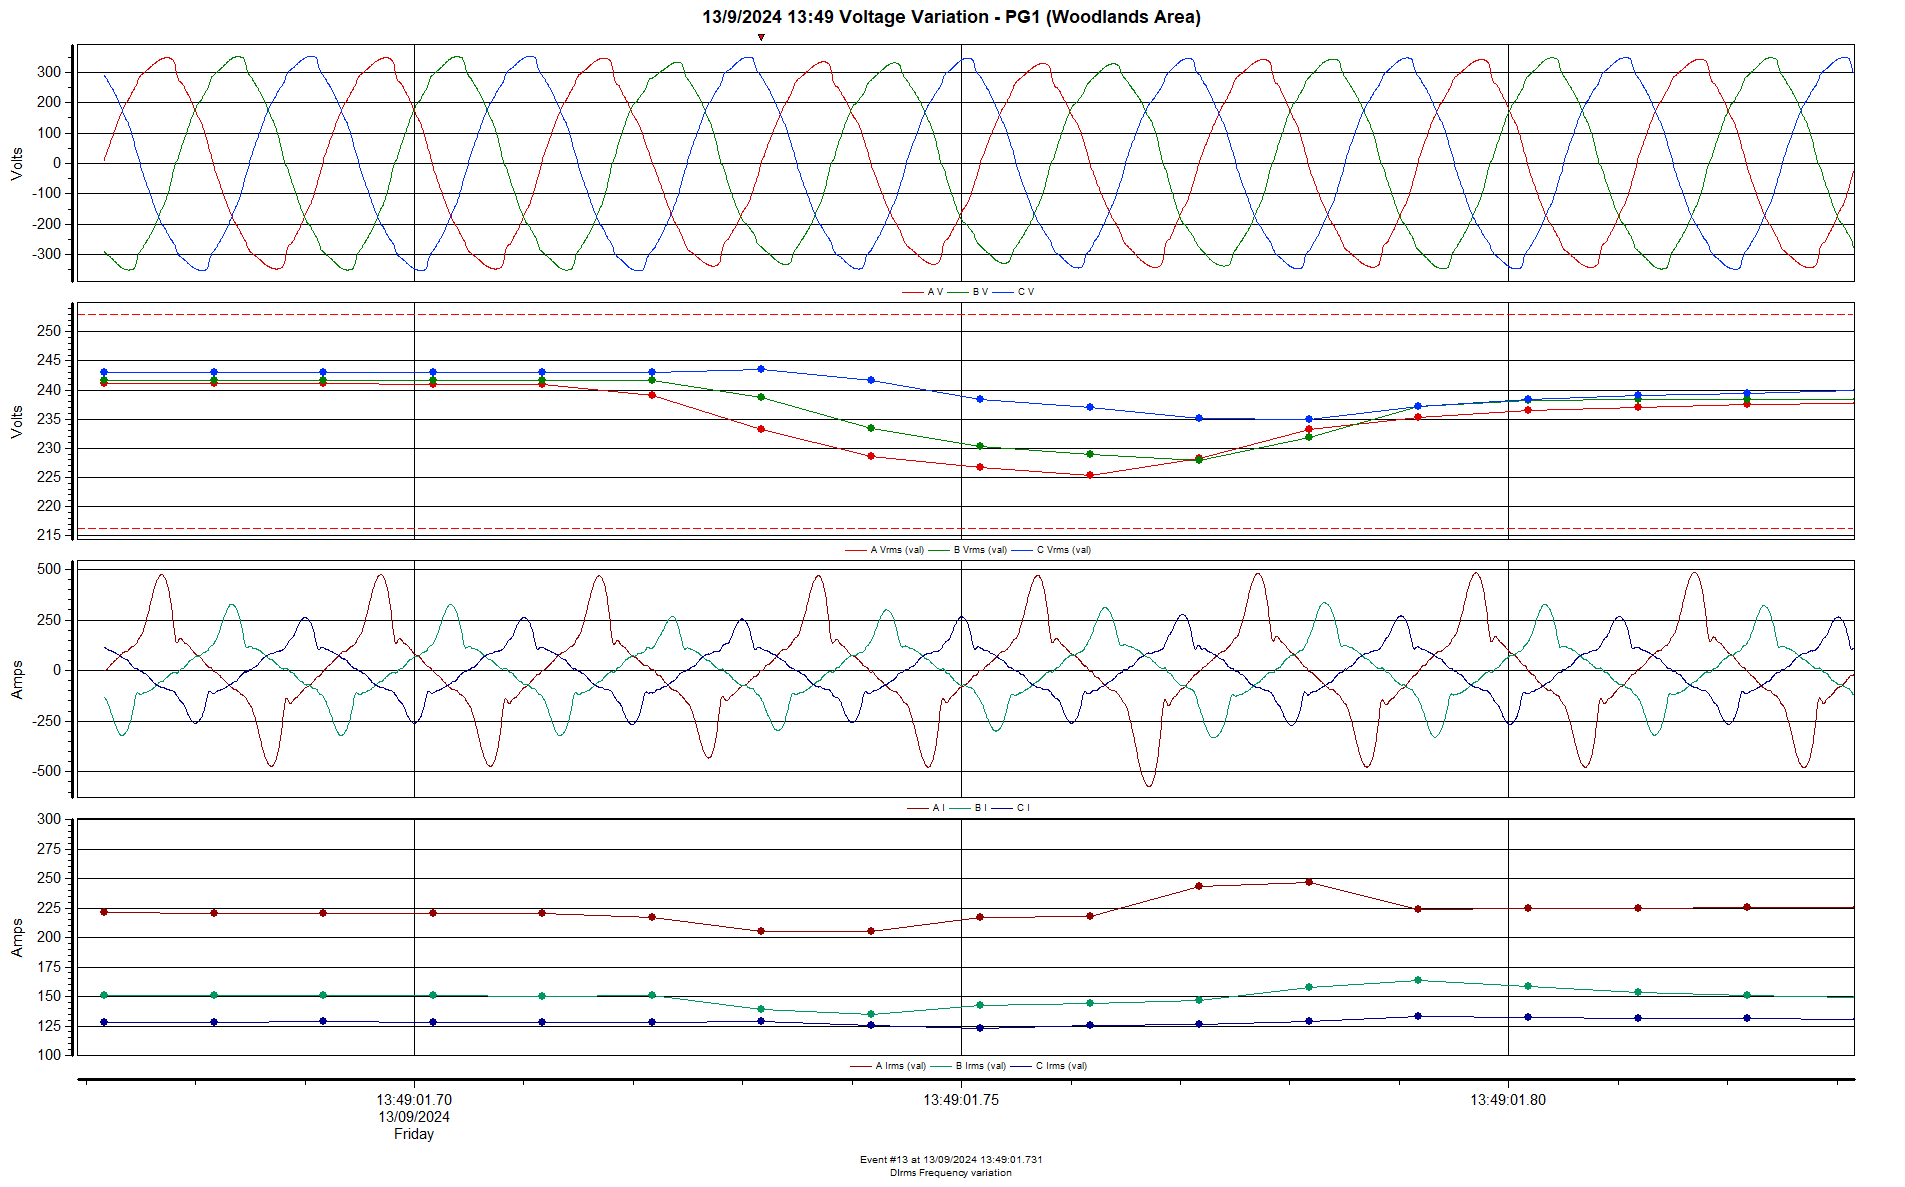
From another portable PQ analyzer that was monitoring in the northern area of Singapore.
From another portable power logger that was monitoring in the western area of Singapore
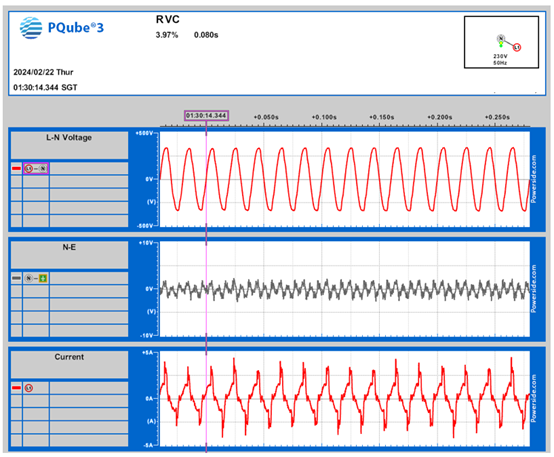
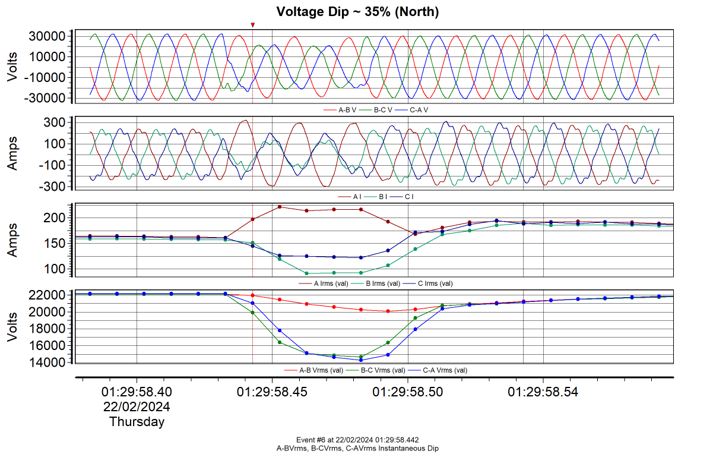
The PQUBE3 installed at my home’s incoming supply (230V Phase L3) detected an RVC (rapid voltage change) of 3.97% during the early morning of Thursday 22/02/2024.
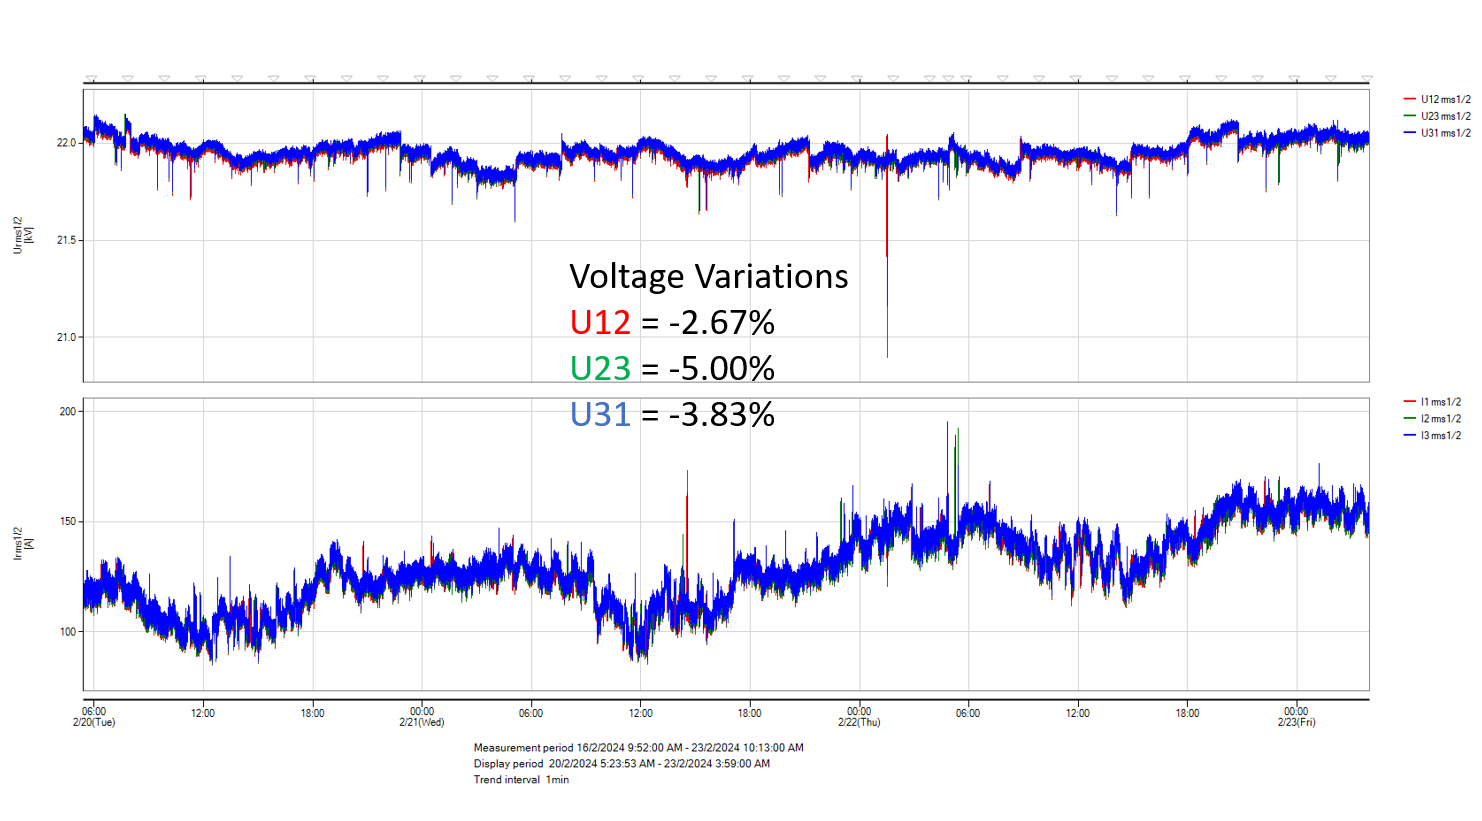
And today, while retrieving a portable PQ monitor from one of our worksites in Banyan Drive, I noticed the following voltage trends (occurred at about the same time as my PQUBE3 event). This was recorded at 22kV.
For these 2 locations (one on the mainland in the western part of Singapore, and another on Jurong Island), to have similar voltage variations suggest that a transmission level fault had occurred during the said date/time.
We have two other sets of portable PQ monitors, one in Loyang (east of Singapore) and another in Marsiling (north of Singapore) which will be due for data retrieval next week. These PQ monitors would have similar stories to tell.
Updated – 28/2/2024
As expected, the other two set of portable PQ monitors captured the same event (at 22kV), with the PQ monitor at the northern part of Singapore saw the worst dip values, which was expected as the fault was made known to have originated from our northern neighbour (TNB – Malaysia).
Here, it can be deduced that it was a single-phase fault on the Blue phase (Phase L3).
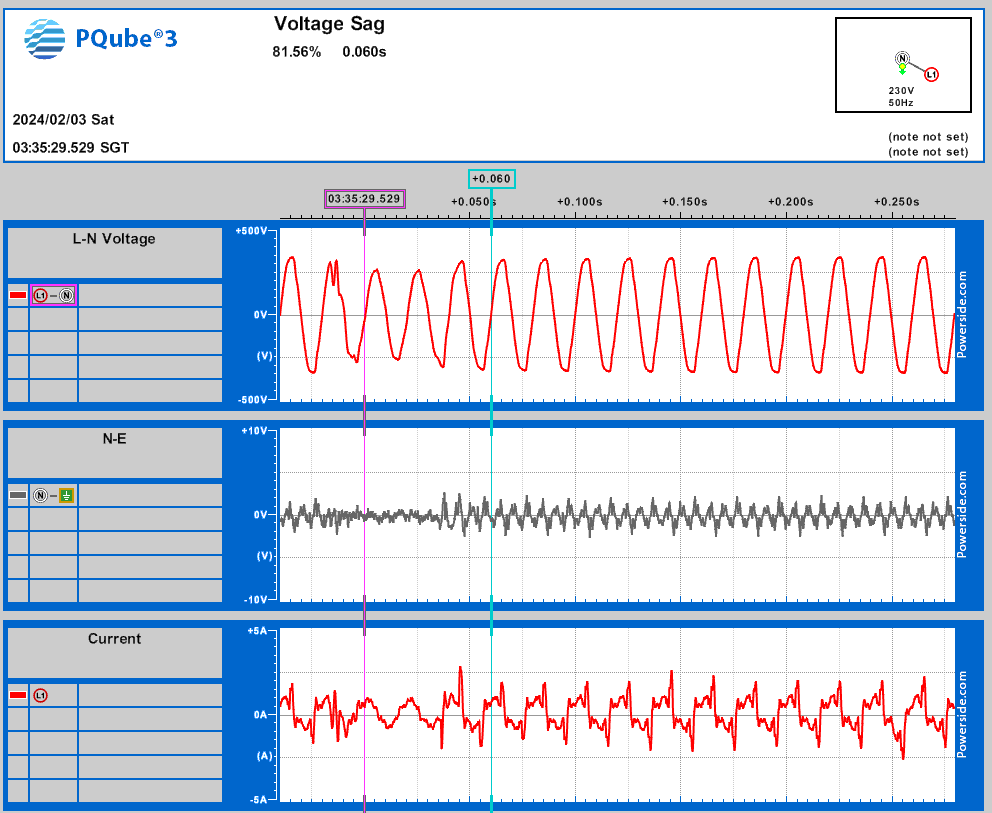
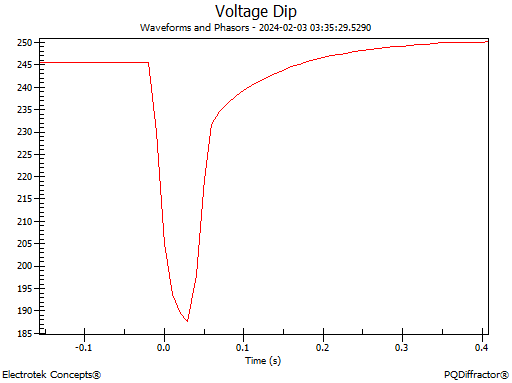
I had a PQUBE3 installed at my home’s incoming supply for about six months now and this was the first voltage dip (or sag) that it captured.
Apparently there was a transmission level cable fault in the Utility’s network. This would mean everyone in Singapore would have ‘seen’ it one way or another (in varying degrees, depending on locations).
My home (western part of Singapore) is taking in 230V single-phase supply (on Phase L3).
The PQUBE3 recorded a voltage dip of 18.44%, for a duration of 60ms (Lowest voltage was 187.6V).
In general, current harmonics contribution from solar PV inverters do not pose much of a power quality problem. Its ITHD is usually small and negligible as compared to a harmonics-producing load such as a variable speed drive (ITHD for a typical 6-pulse drive ranges between 30% – 50%).
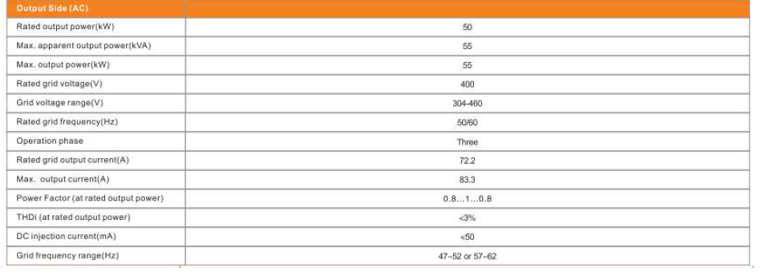
Typically, one will find a Current Total Harmonic Distortion of 3% stated in the datasheet for a quality-brand inverter, as seen here.
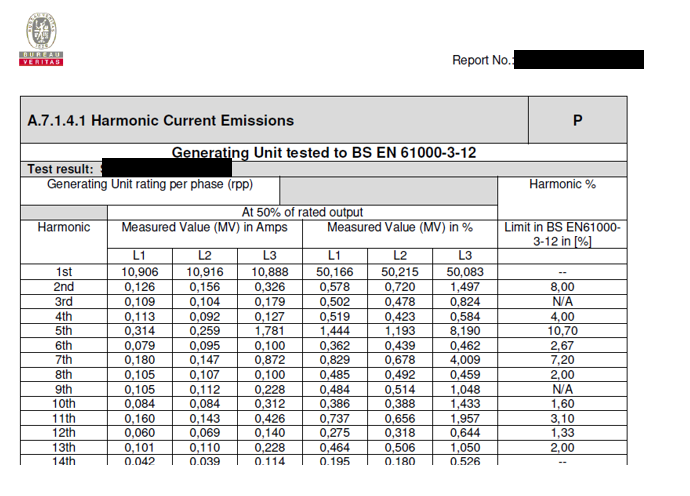
In Singapore, for a Grid-Tied Solar PV connection, the Licensed Electrical Worker (LEW) (i.e Qualified Person) will have to submit the inverter’s PQ-related type test report to the Grid operator (SP Group). Below is one such example – here it shows the portion whereby the inverter was tested as part of the UK Engineering Recommendation G99 test requirements. Values stated for quality-brand inverters will have its harmonic current emission values well within the limits.
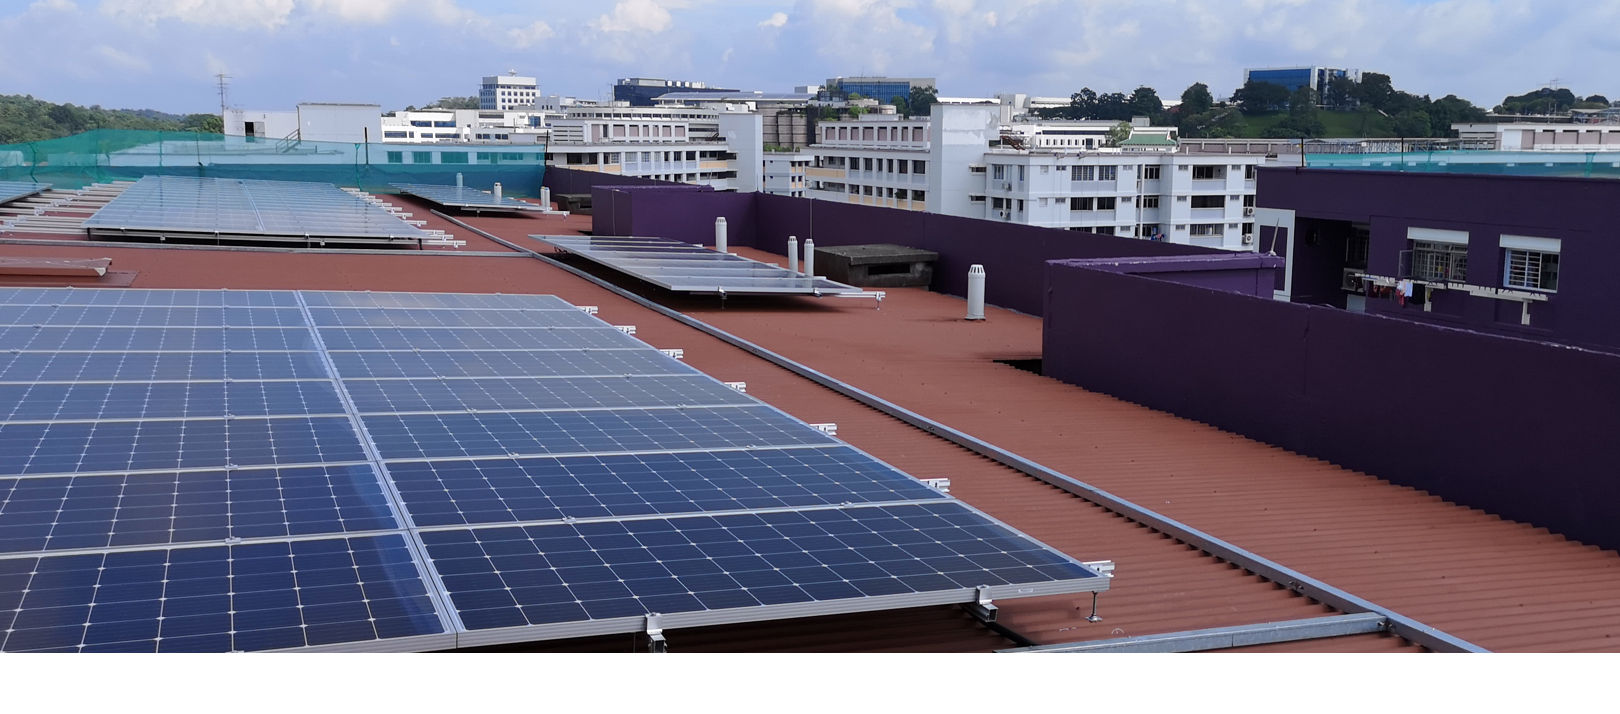
You may wonder – One inverter is ok but how about a number of them accumulatively? I had the opportunity to measure numerous sites whereby the rated PV output was accumulatively more than 1MWac.
Here are two sites whereby the background harmonics can be considered to be on the low side and as such the effects of the on-site inverters were more representative (limited ‘contributions’ from the localized electrical network).
All measurements were done using an IEC 61000-4-30 Class A certified Power Quality instruments.
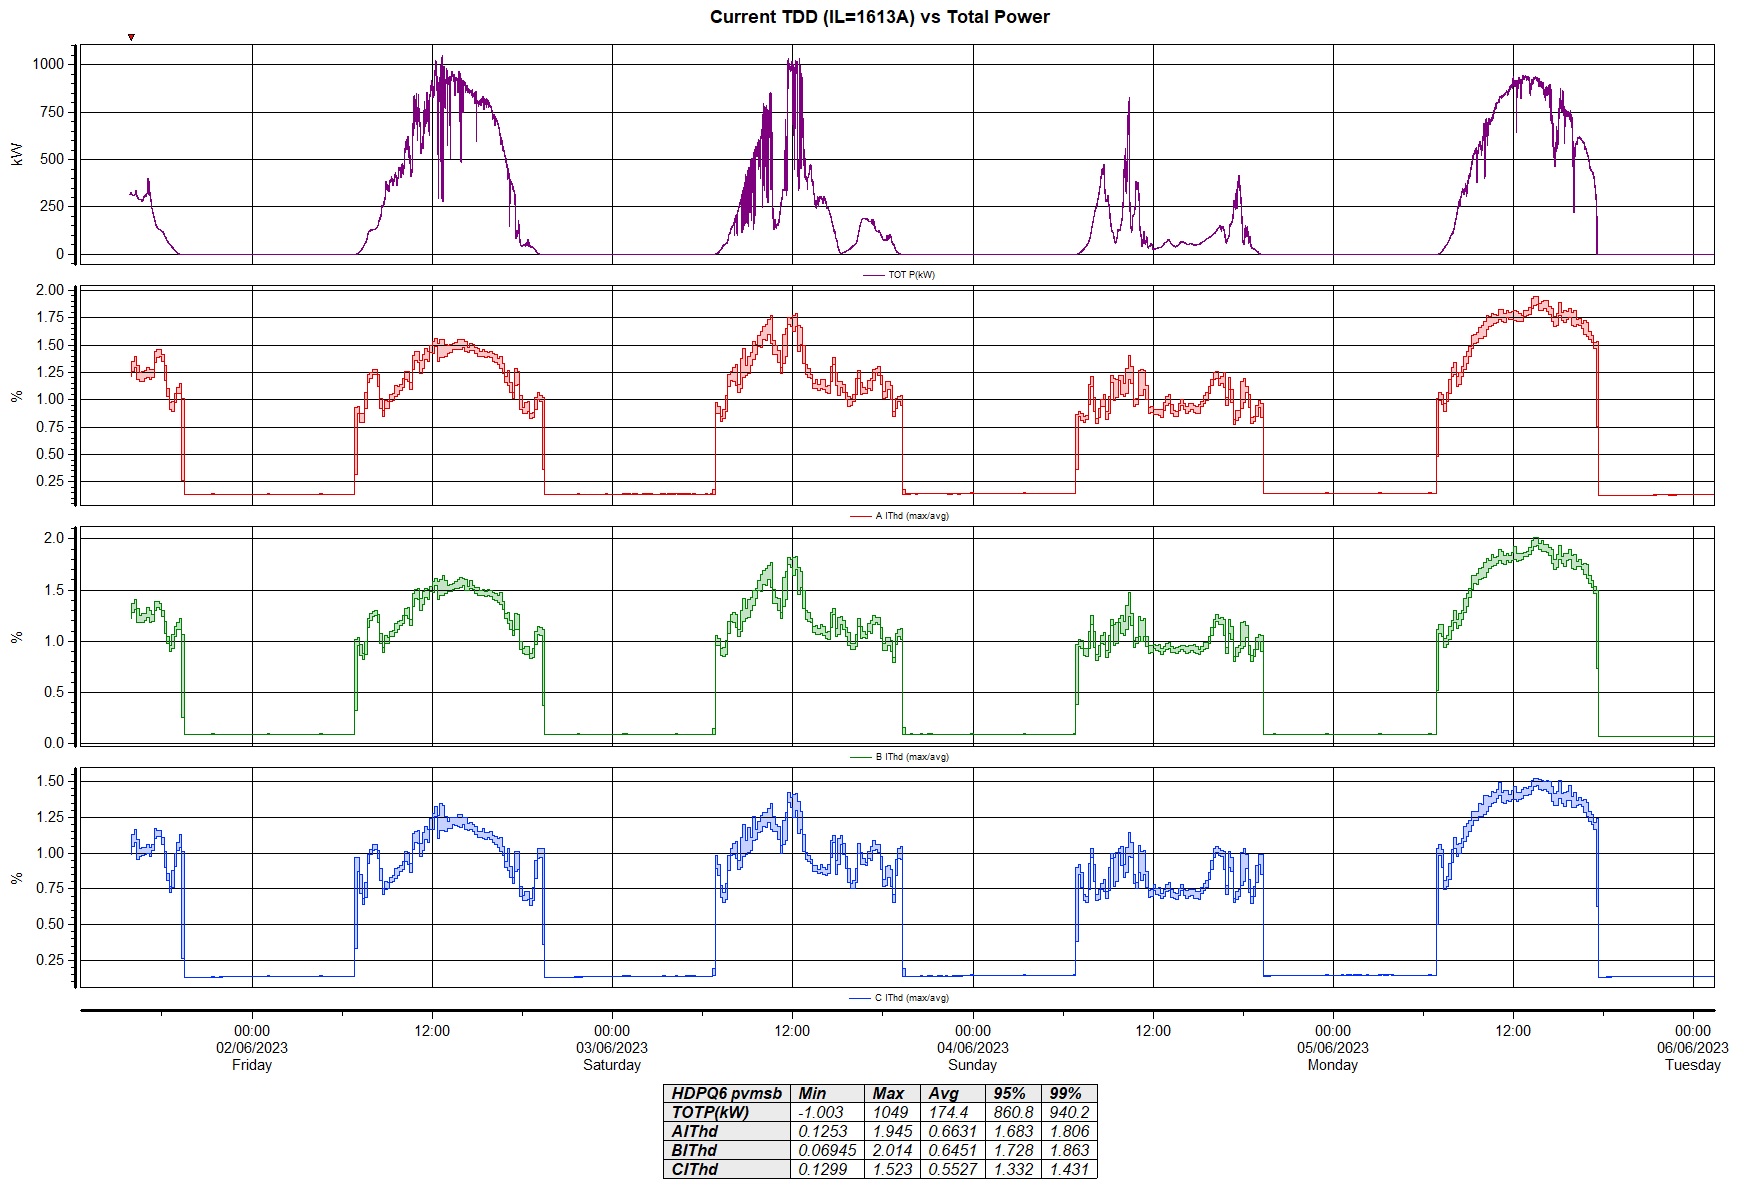
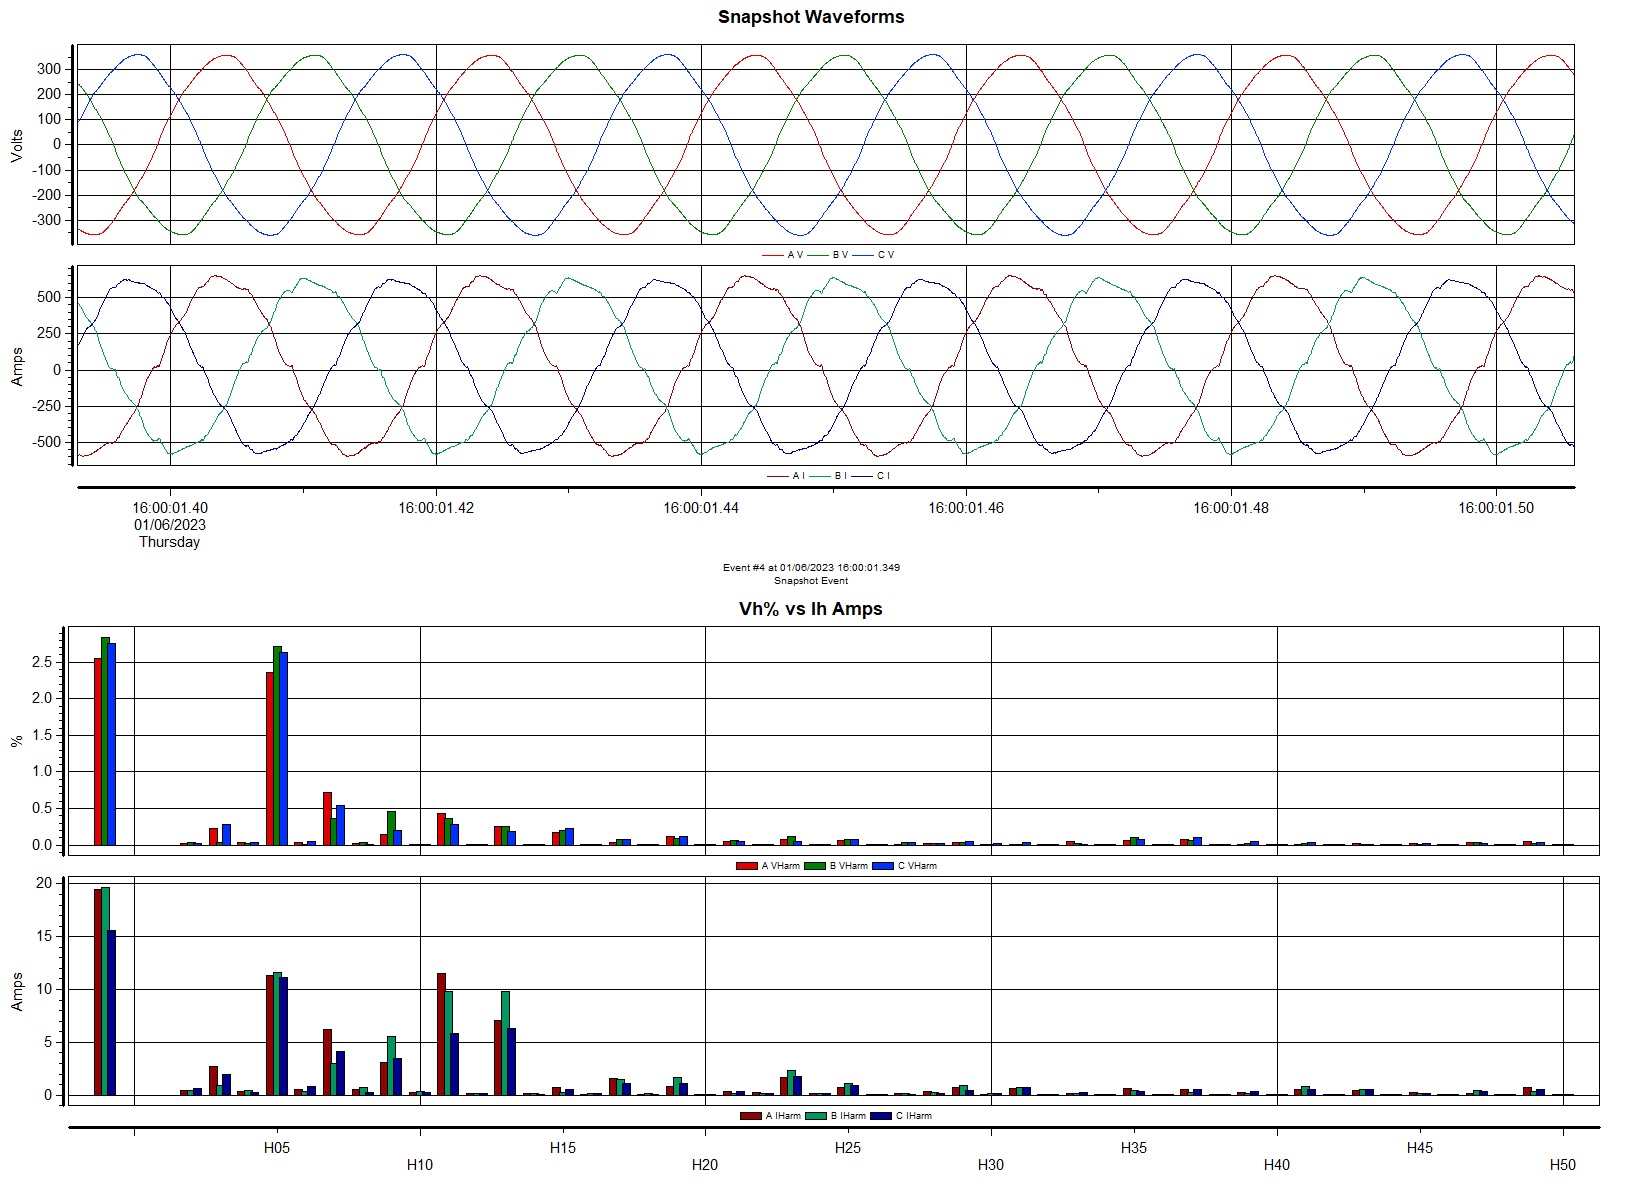
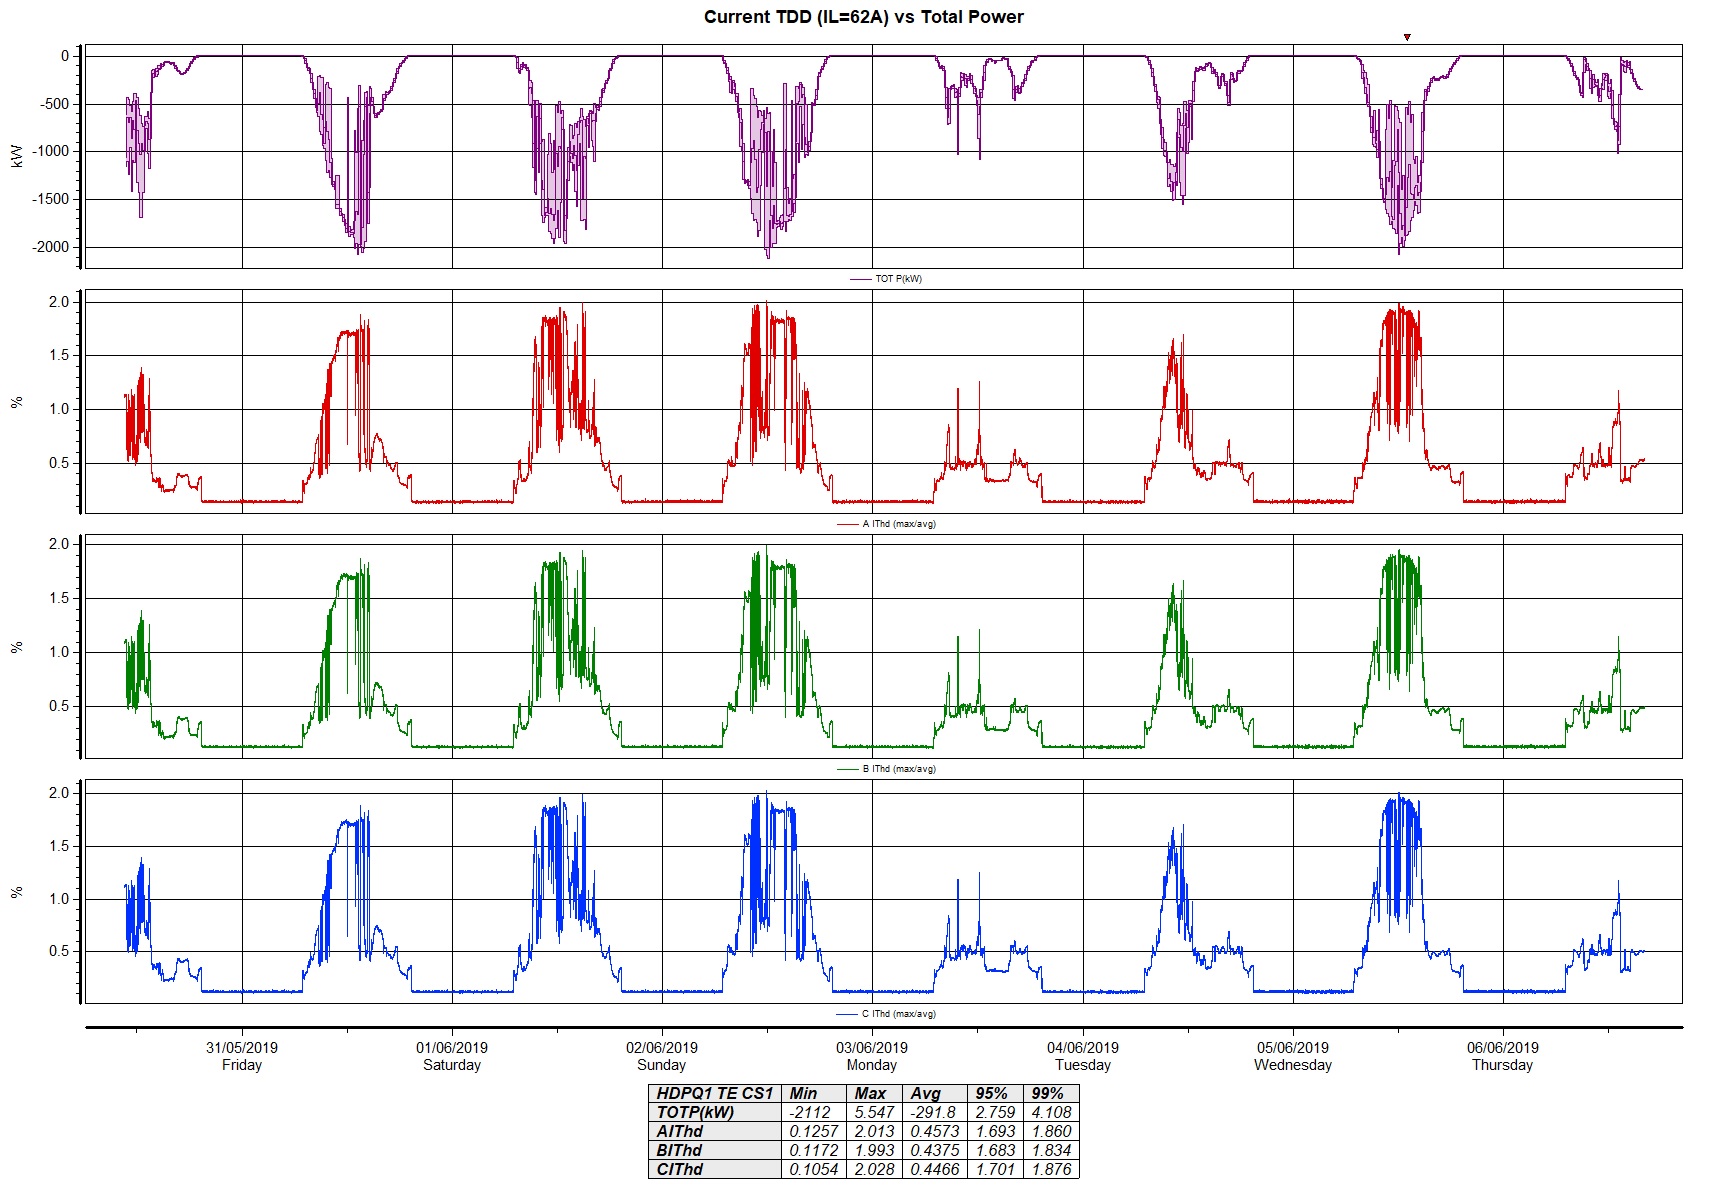
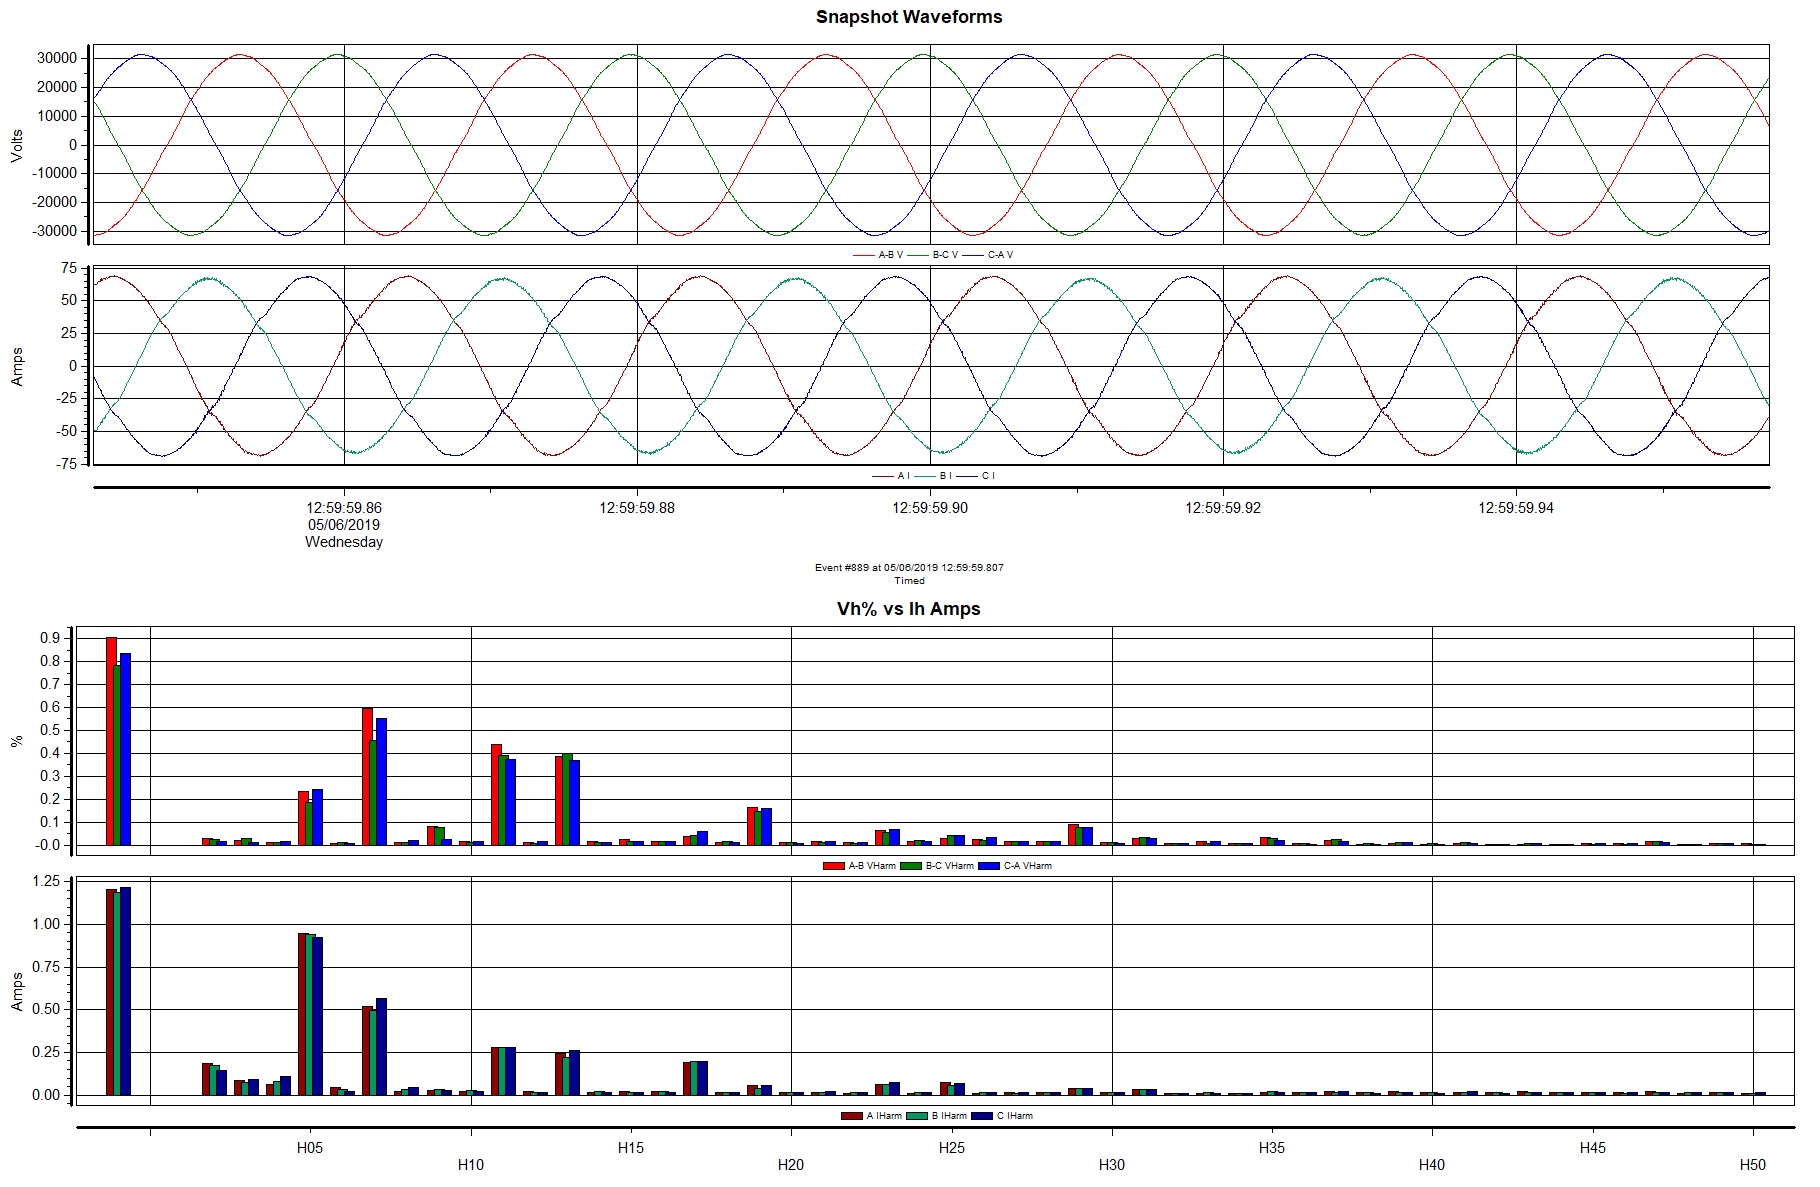
The Current Harmonic Distortion (ITHD) in the trends below have been scaled to the respective aggregated inverters’ rated current (in other words, shown here as Total Demand Distortion (TDD) values).
As observed here, the TDD values were less than 3% and the sinusoidal shape of the current waveforms were very much still visible.
Note: IEEE 519 recommends TDD values of 5% for power generation facilities.
Site #1:
Premises Type: Warehousing / logistics PV Size: 1352.8 kWp Aggregated Inverter(s) Rated Current = 1613A @ 400V. Measurement Point: 2500A PV-AC DB, directly connected to the Premises 5000A Main Switchboard (served by a 3MVA transformer) via 3000A flexible CTs (clamped on 3 sets of 500sqmm cables per phase). CT direction towards MSB as Load, PV as Source. VTHD: 0.89% – 3.96% (CP95: 3.6%).
Site #2:
Premises Type: Solar Farm (On-site loads: Auxiliary power and lighting loads only) PV Size: 2652kWp (for CS1) Aggregated Inverter(s) Rated Current = 62A @ 22kV (for CS1). Solar inverters connected at 400V, stepped-up to 22kV via a 2.5MVA transformer. Measurement Point: 22kV Incomer 1 from PowerGrid (CS1) via VT and CT. Note: Solar Farm has 2 x 22kV intakes from PowerGrid – only one intake shown here. CT direction towards PV as Load. Solar Farm was connected to a Lightly-loaded 22kV distribution network. VTHD: 0.59% – 1.22% (CP95: 1.09%).