A critical step in conducting an accurate power or power quality monitoring is the measurement/monitoring setup itself.
There are generally three guiding principles, to verify that the voltage and current probes have been connected correctly, to the ‘Circuit Under Test’.
- Voltage and Current phasor pairings are ‘together’
(An inductive circuit will have the I lagging the V, and a capacitive circuit will have the I leading the V). - Positive ‘Watts’ values
(for a load centre). - The context/background of the measurement
Many consider that the first two principles are sufficient to ensure a correct connection of the instrument to the ‘Circuit Under Test’.
Unfortunately, this is not 100% true.
The context of the measurement will still need to be considered closely.
For instance, monitoring at load-end and seeing power factor values in the region of 0.5-0.6 may be ‘normal’.
But to see these same poor power factor values at the main incomer circuit of a large electrical installation? Well, one should re-check at how the instrument was connected.
The following example illustrates the importance of context/background of the measurement.
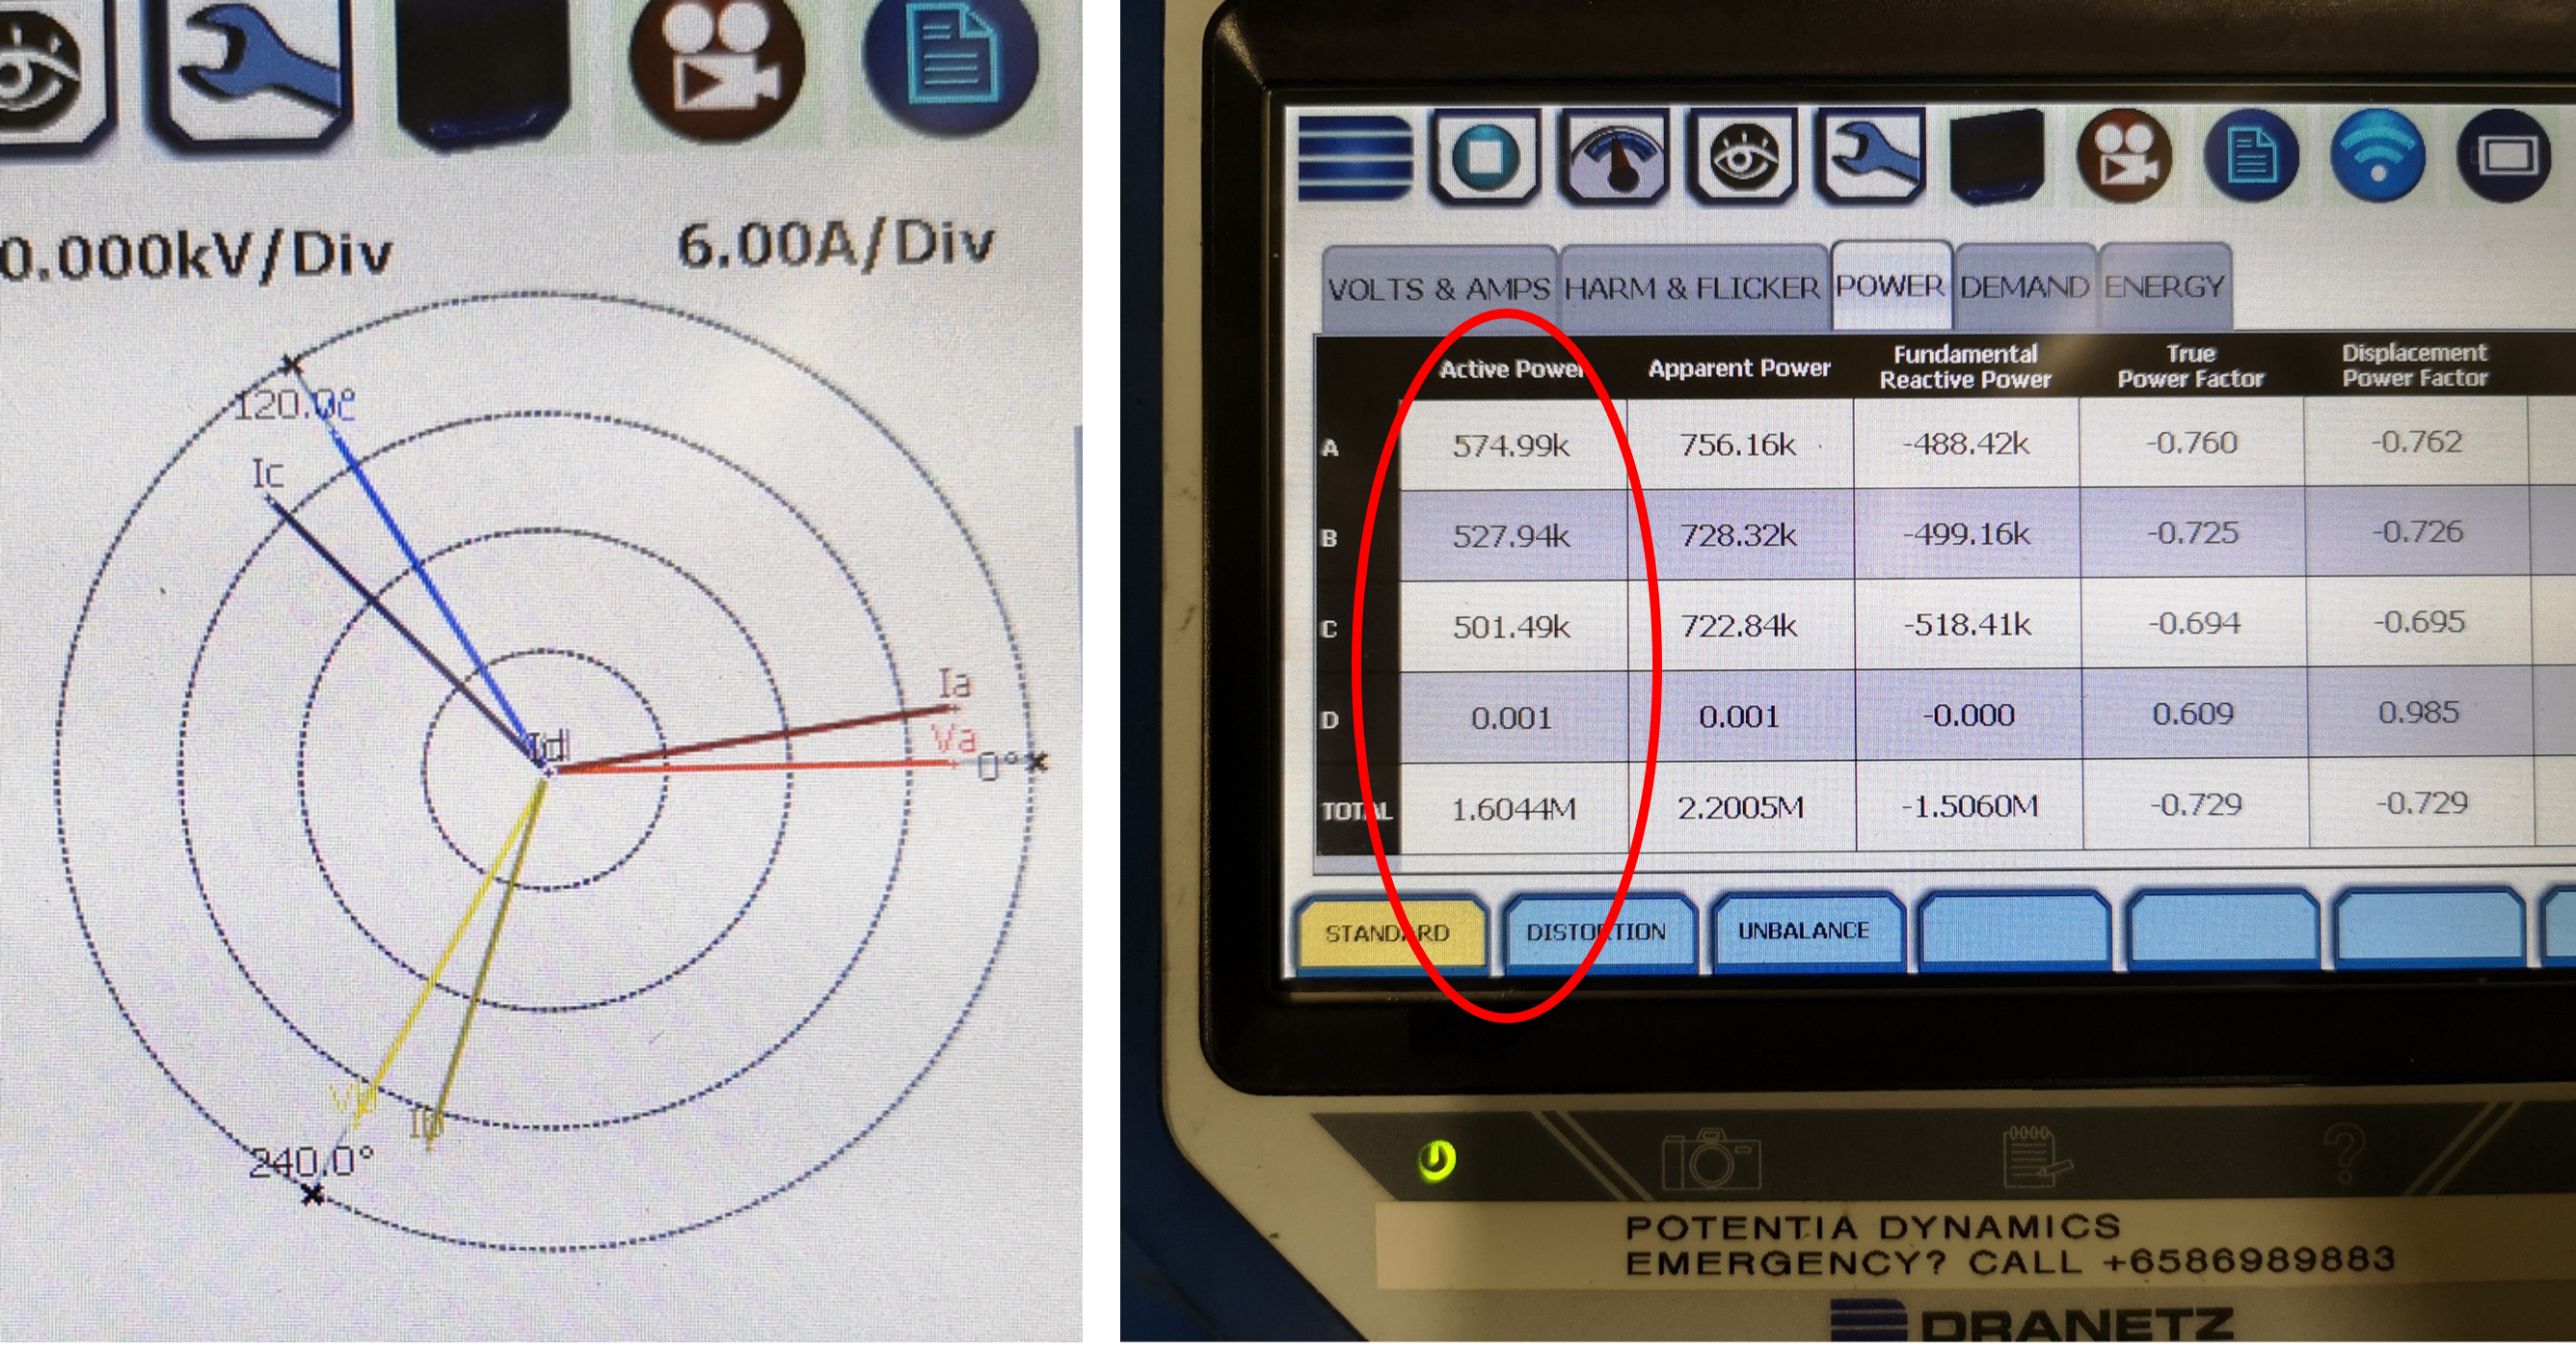
In one simple glance, values shown on the analyzer seem ok.
- The first two guiding principles were met.
- Voltage values seems to match the switchboard’s voltmeter.
- Current values seems to match the switchboard’s ammeter.
However, the power factor seems to be very poor, for an incomer circuit of a large electrical installation complex.
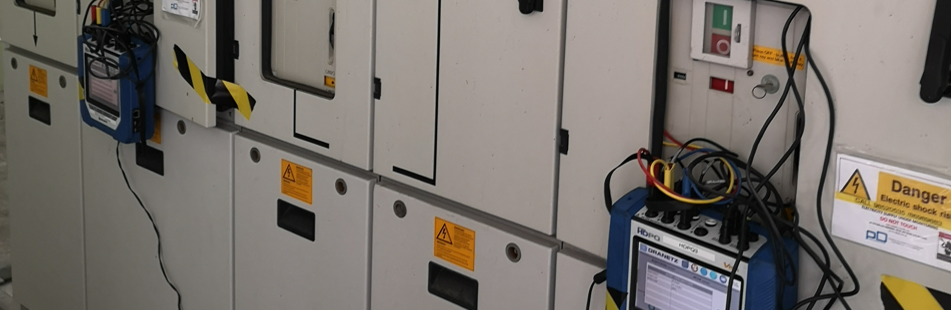
For context, these were the characteristics of the ‘Circuit Under Test’
- It is at medium-voltage level (with an active voltage regulation).
- At this MV level, the electrical installation will be penalized when the kVarh of the month exceeds 62% of its kWh consumption (translates to a power factor of poorer than 0.85).
- Loadings at this incomer level are expected to be fairly balanced.

Thus, it is highly unlikely that the phasor diagram obtained is true of the ‘Circuit Under Test’.
Further checks revealed that two different set of errors have occurred upon connection of the instrument to the circuit.
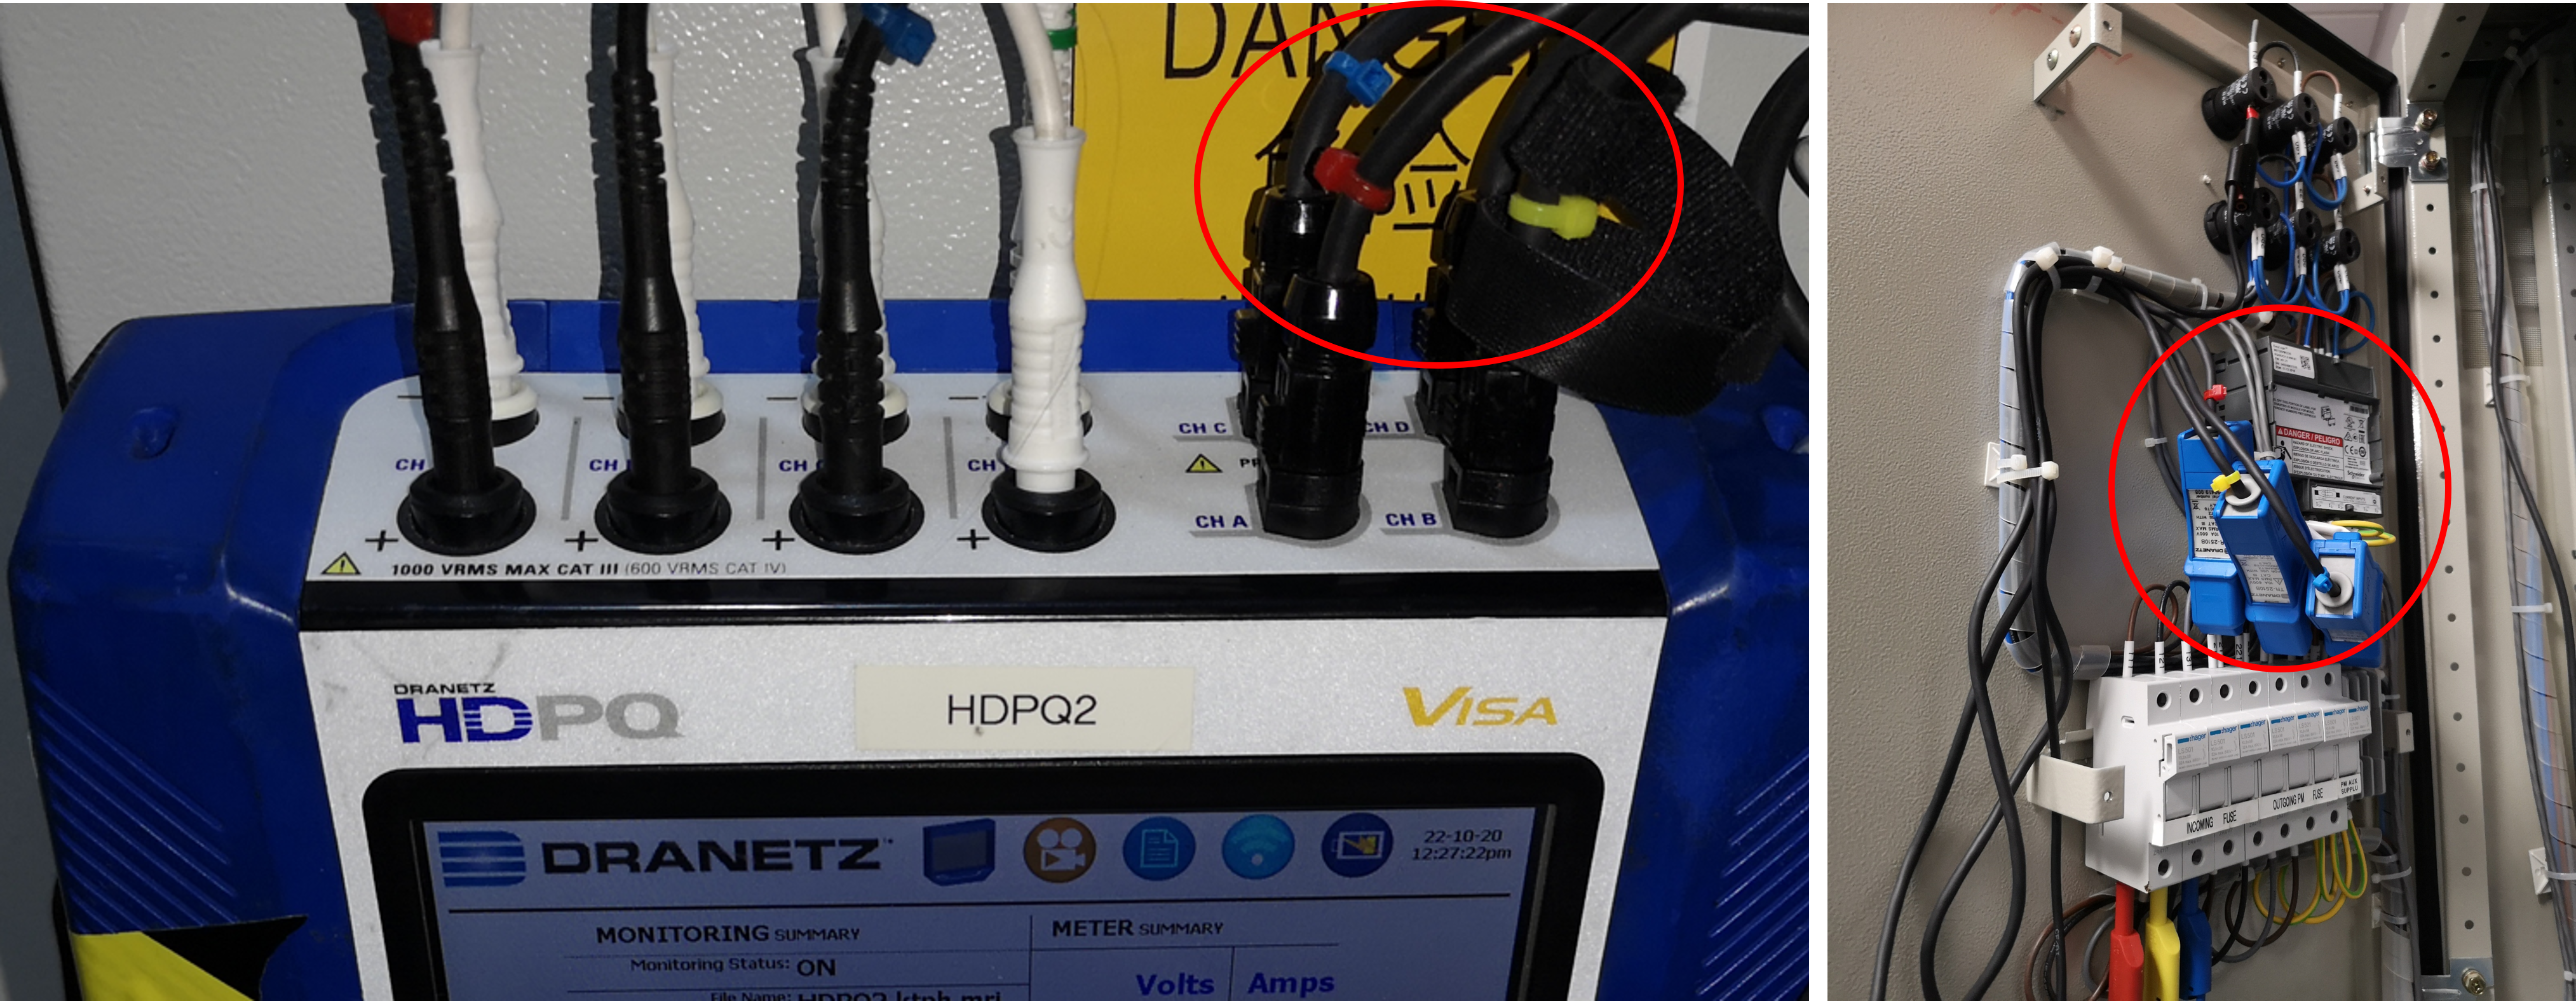
- Wrong phase was clamped
Clamp I1 was on Phase I3; Clamp I2 was on Phase I1; Clamp I3 was on Phase I2 - Wrong direction
The clamps ‘arrow’s were pointed towards source (instead of load).

It was also observed that the clamps used in this measurement have not been labelled (I1, I2, I3, etc respectively). This probably contributed significantly in the errors above.
A good practice is to have all the voltage test leads and clamps test leads labelled (on both ends) before ever using the instrument on-site.