Power quality isn’t a new word or term. It has been around for ages. However if one is to search around, there isn’t much information available with regards to this topic here in Singapore.
It is very much still a niche area in the local electrical engineering scene.
Hence, the birth of this blog/site. It is the author’s intention to fill this gap of information here in this website and at the same time a platform to share the author’s views & experiences gained in the subject.
The author is currently the Lead Engineer at Potentia Dynamics Pte Ltd, an engineering & consulting company.
Course Title: Essentials of Power Quality Monitoring & Analysis. PEB PDU Points = 6.
Objective: This 1-day course aims to provide a good understanding of the fundamental power quality concepts for conducting a proper power quality monitoring and assessment.
What Participants Will Learn: You will learn to identify the various PQ problems, its standards/guidelines and applications. This includes on how to conduct a proper PQ assessment and PQ submission to the local authority.
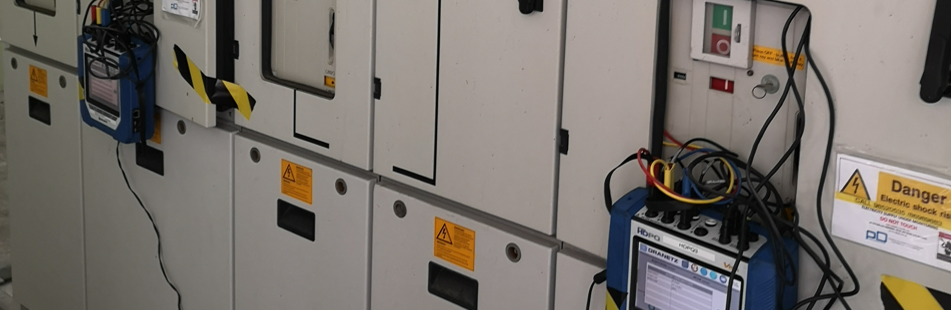
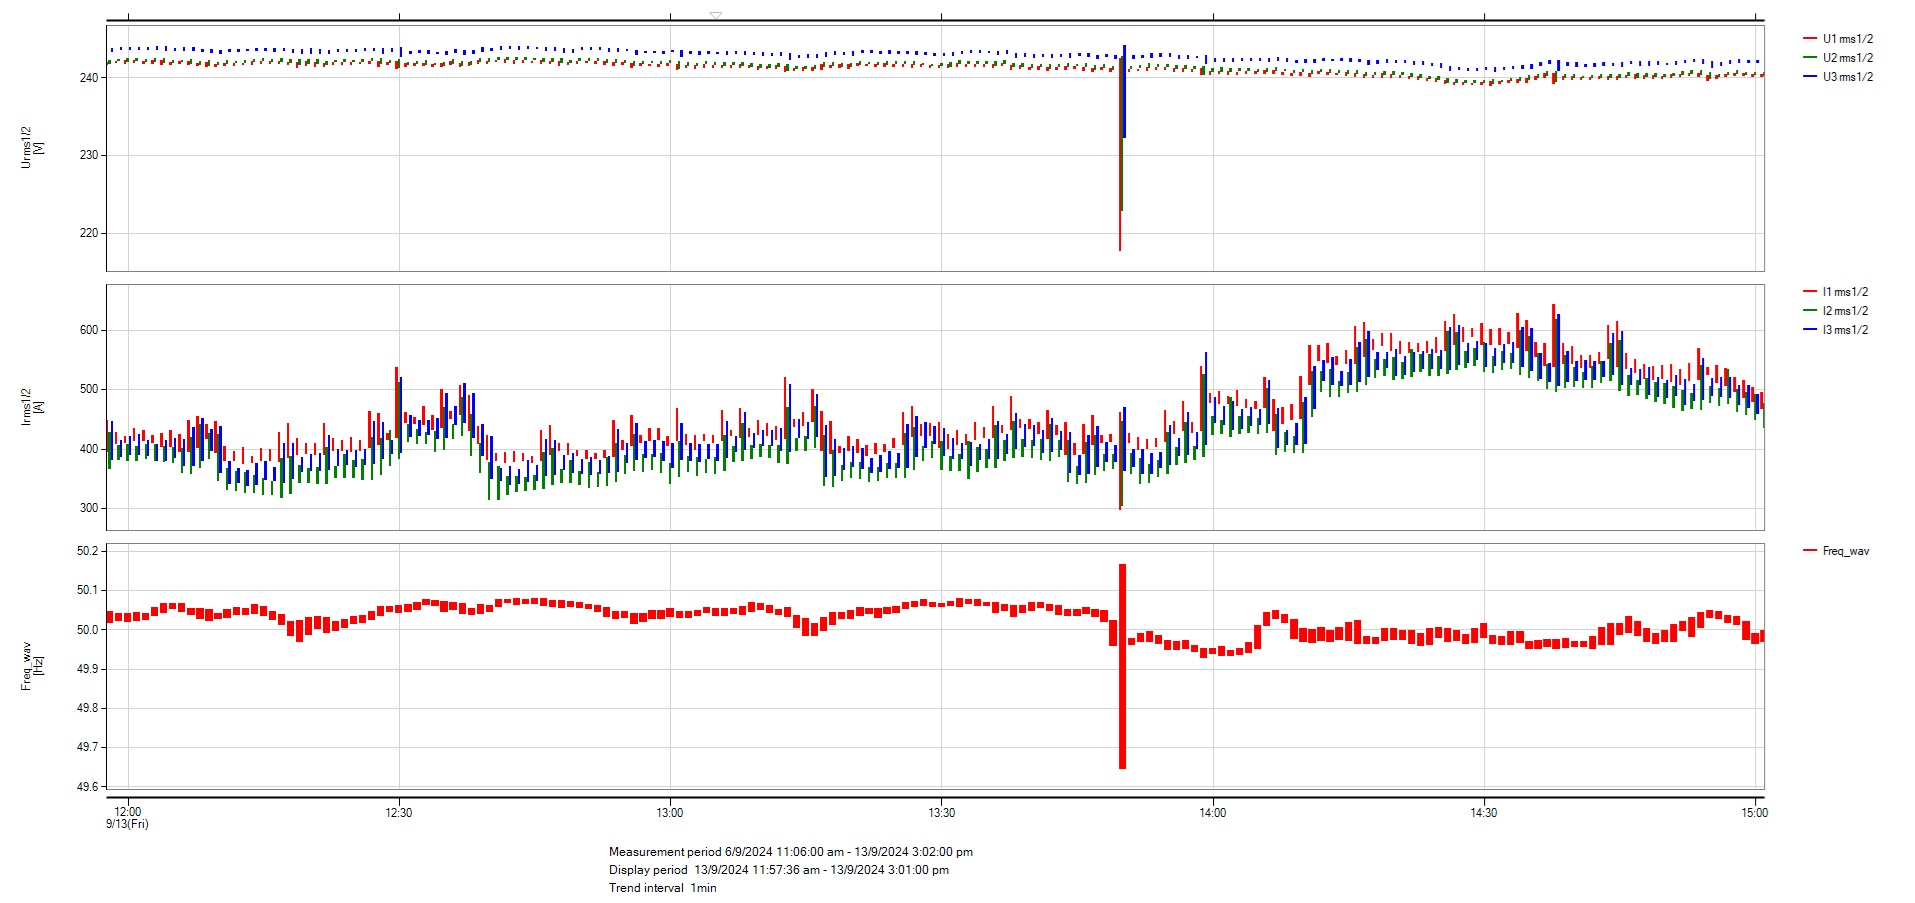
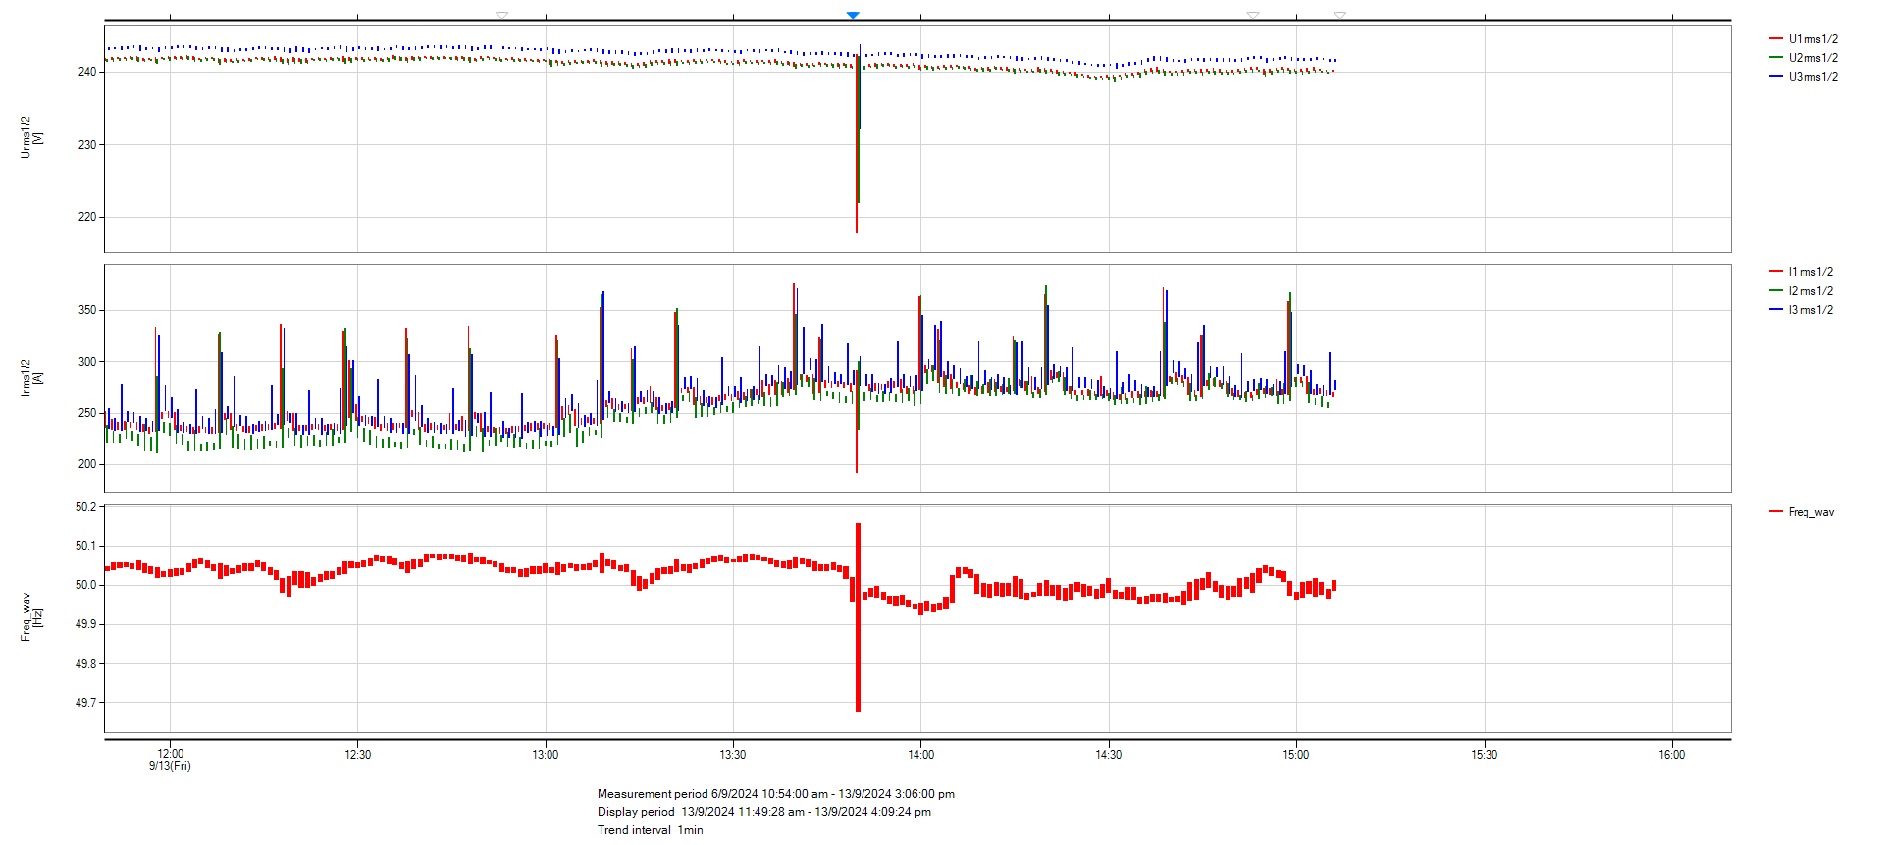
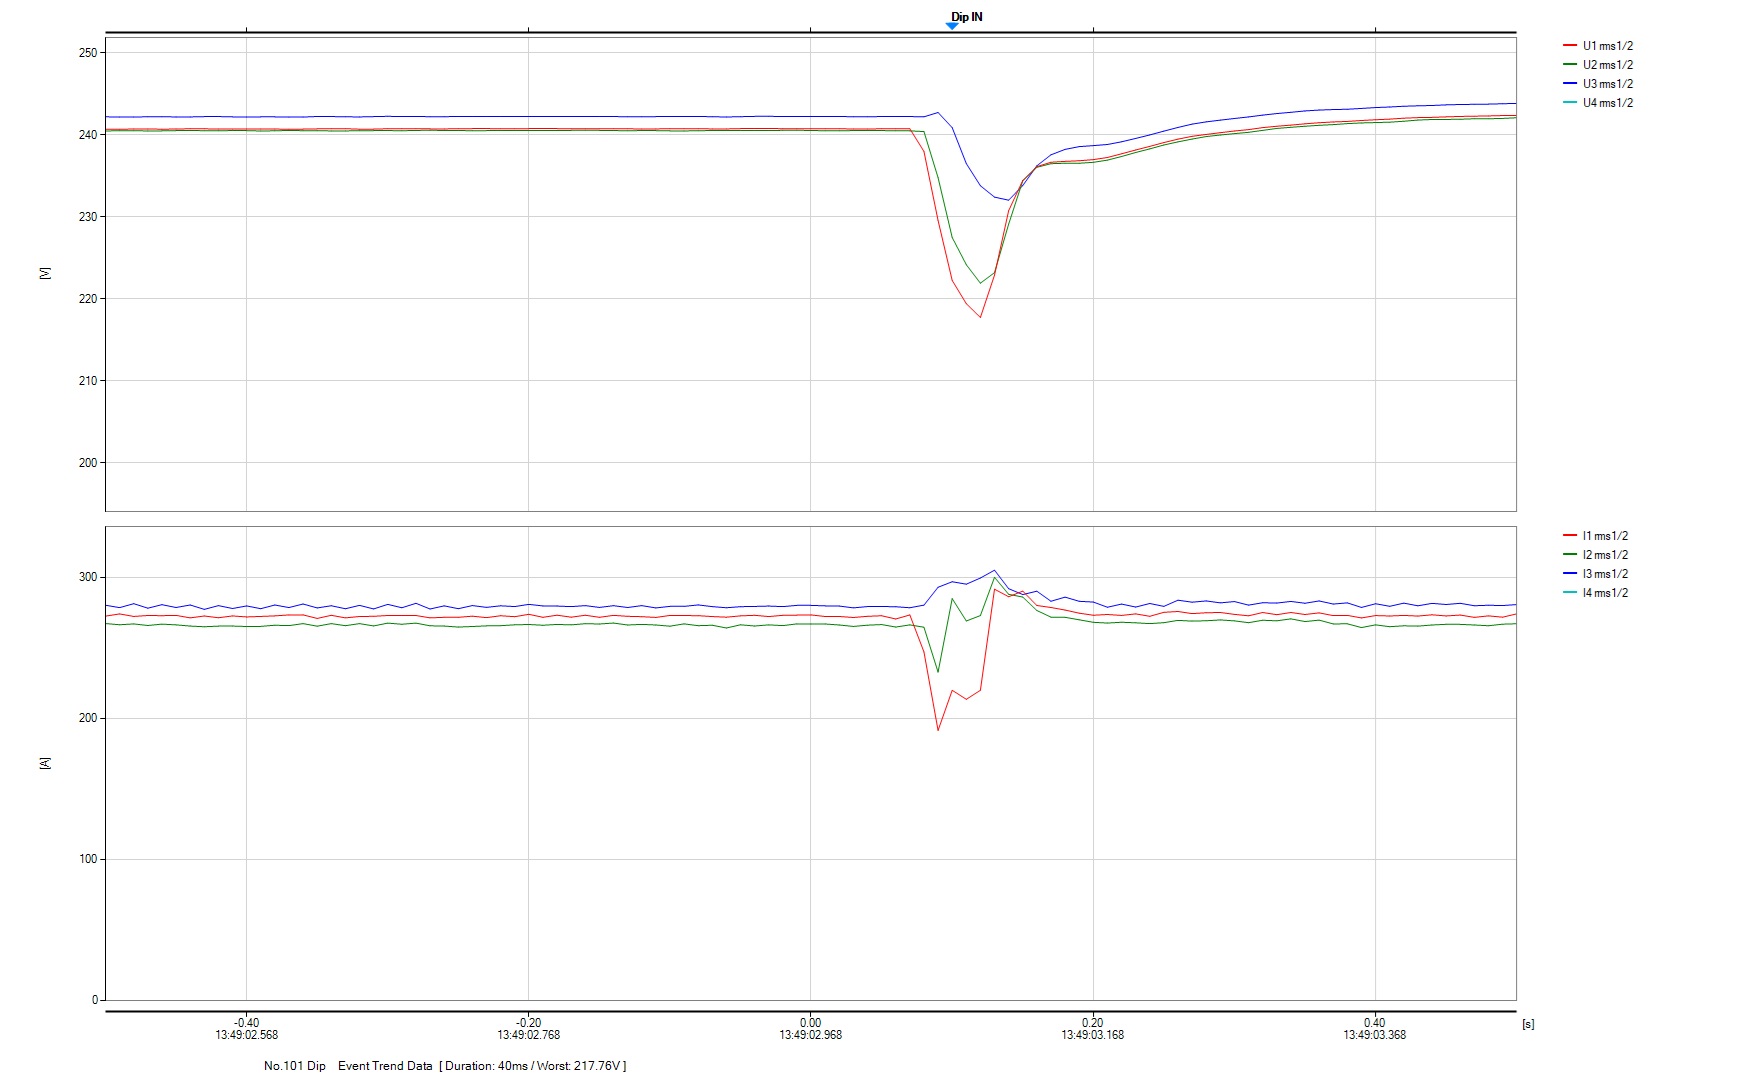
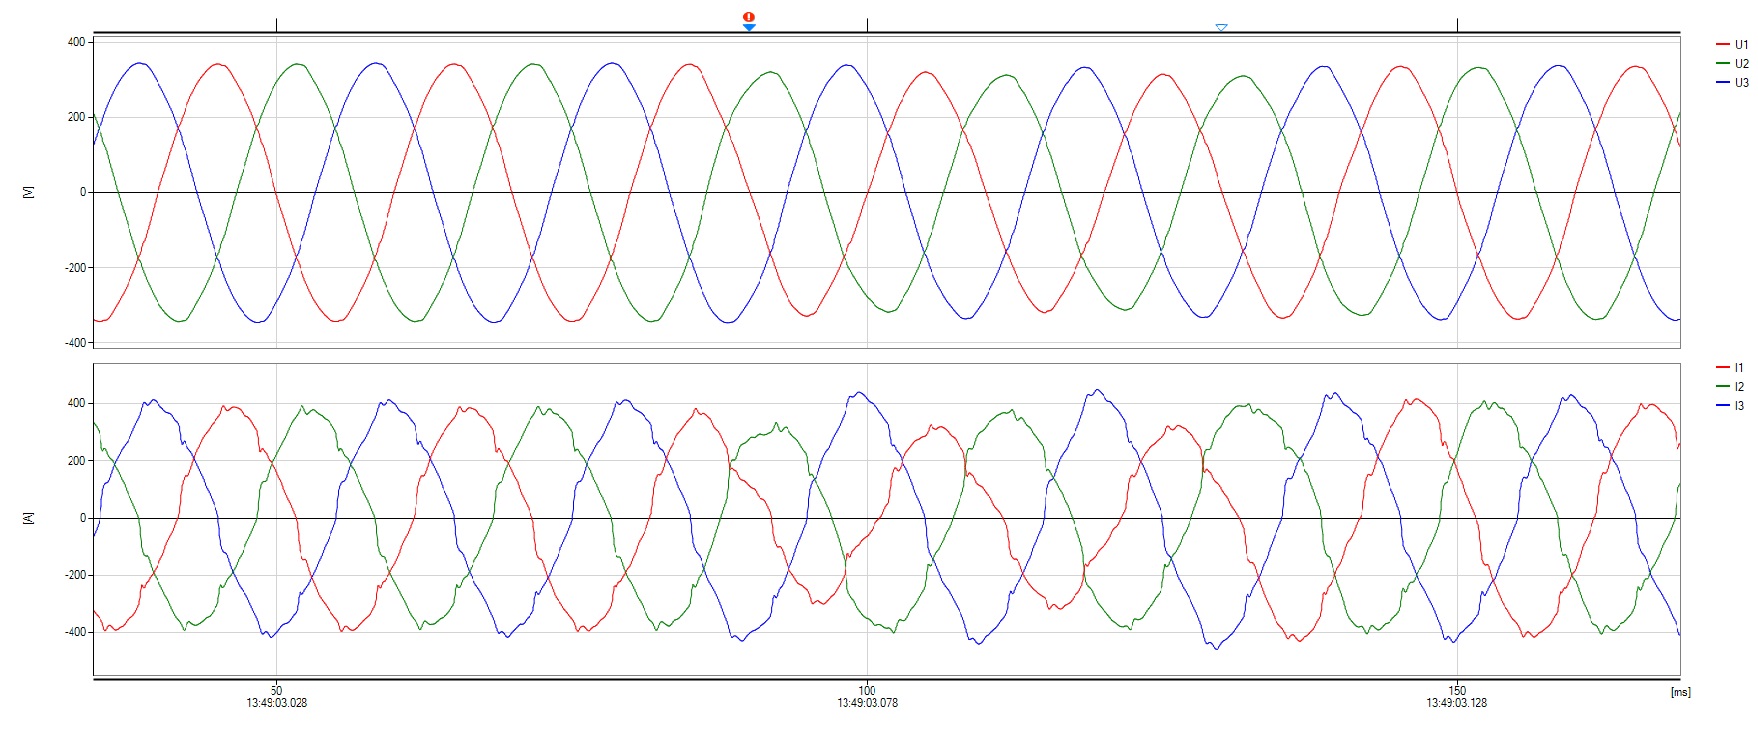
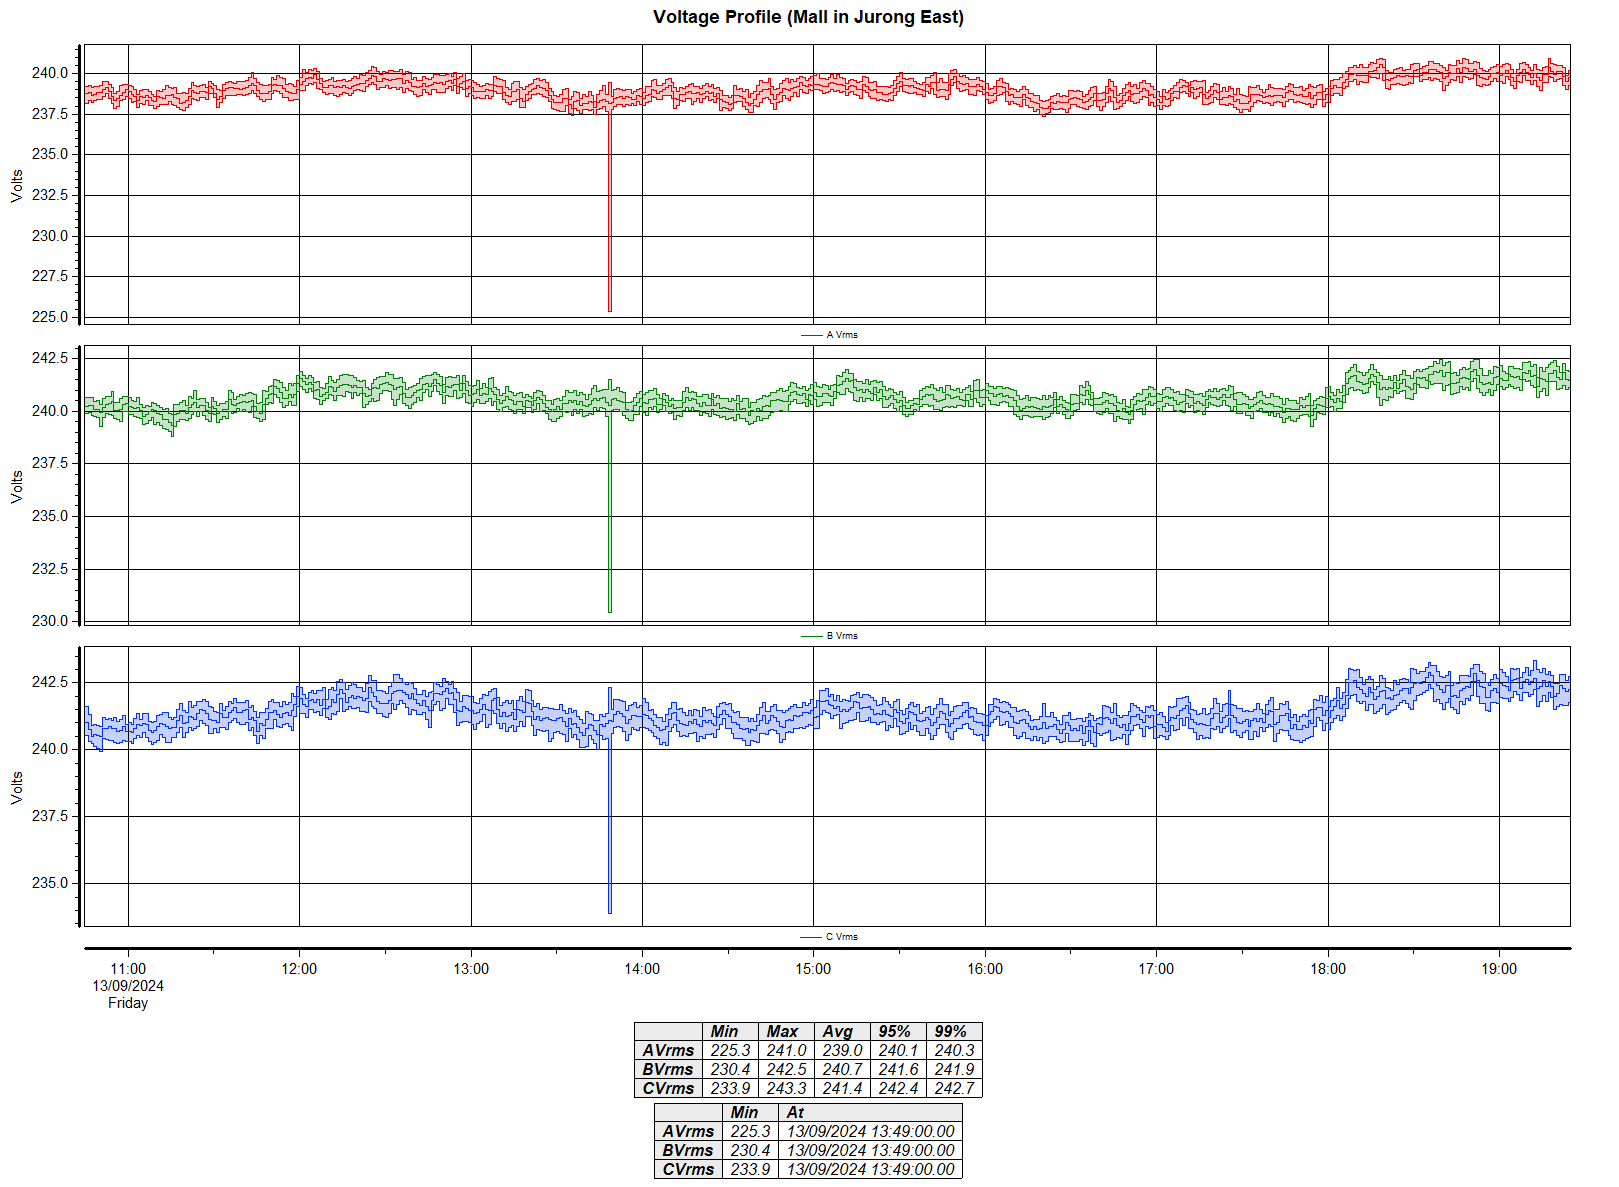
Earlier this afternoon, our portable PQ analyzers (monitoring at Low Voltage) at two different main incomers (in Loyang/Changi) saw a significant drop in voltages.
Technically, not a voltage dip here as the drop was less than 10% of the nominal 230V.
Apparently other parts of Singapore also experienced some form of voltage disturbance (dip or variation), depending on their locations (including my home – which is about 40km away from Loyang/Changi). Thus, confirming this was a transmission level related event.
Update: Due to a 230kV cable fault (single-phase fault on Phase L2) in Jurong Island.
Here are just some trends and a waveform of the event that was captured by our portable PQ analyzers.
At LV PG Incomer 1At LV PG Incomer 2
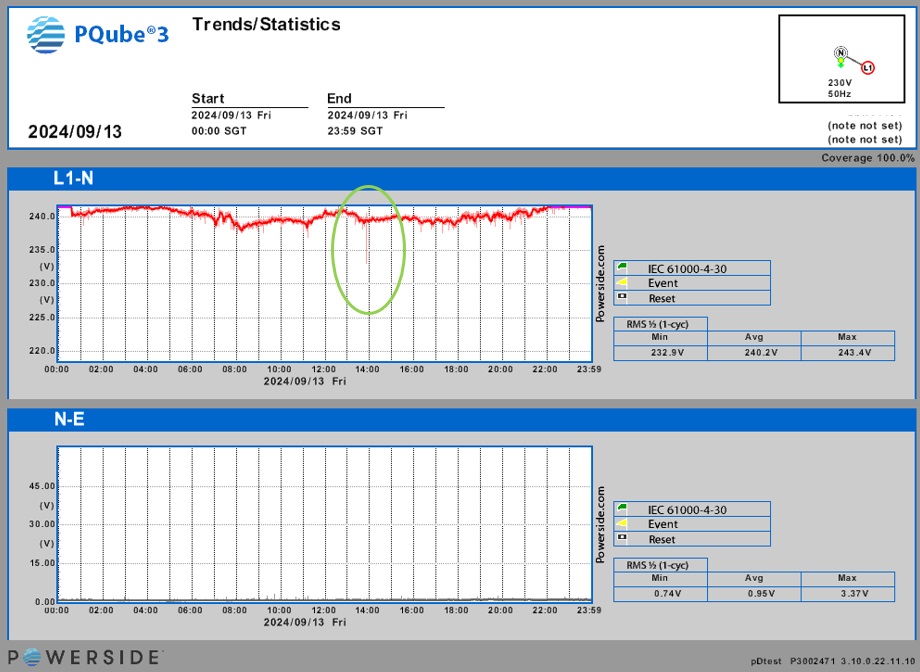
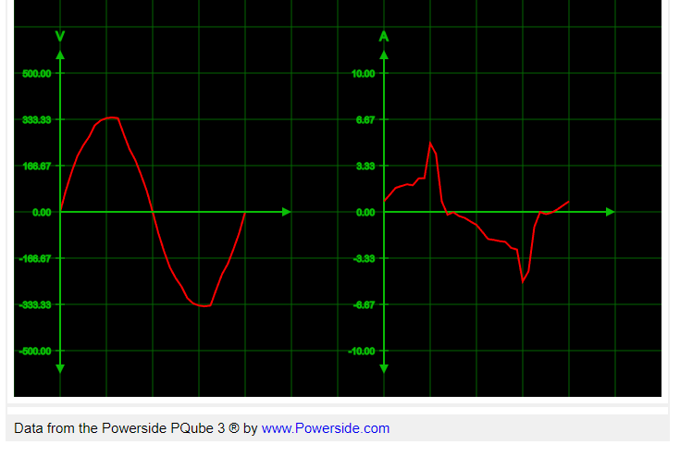
And the voltage trend from my home’s PQUBE3,
Updated 20/9/2024:
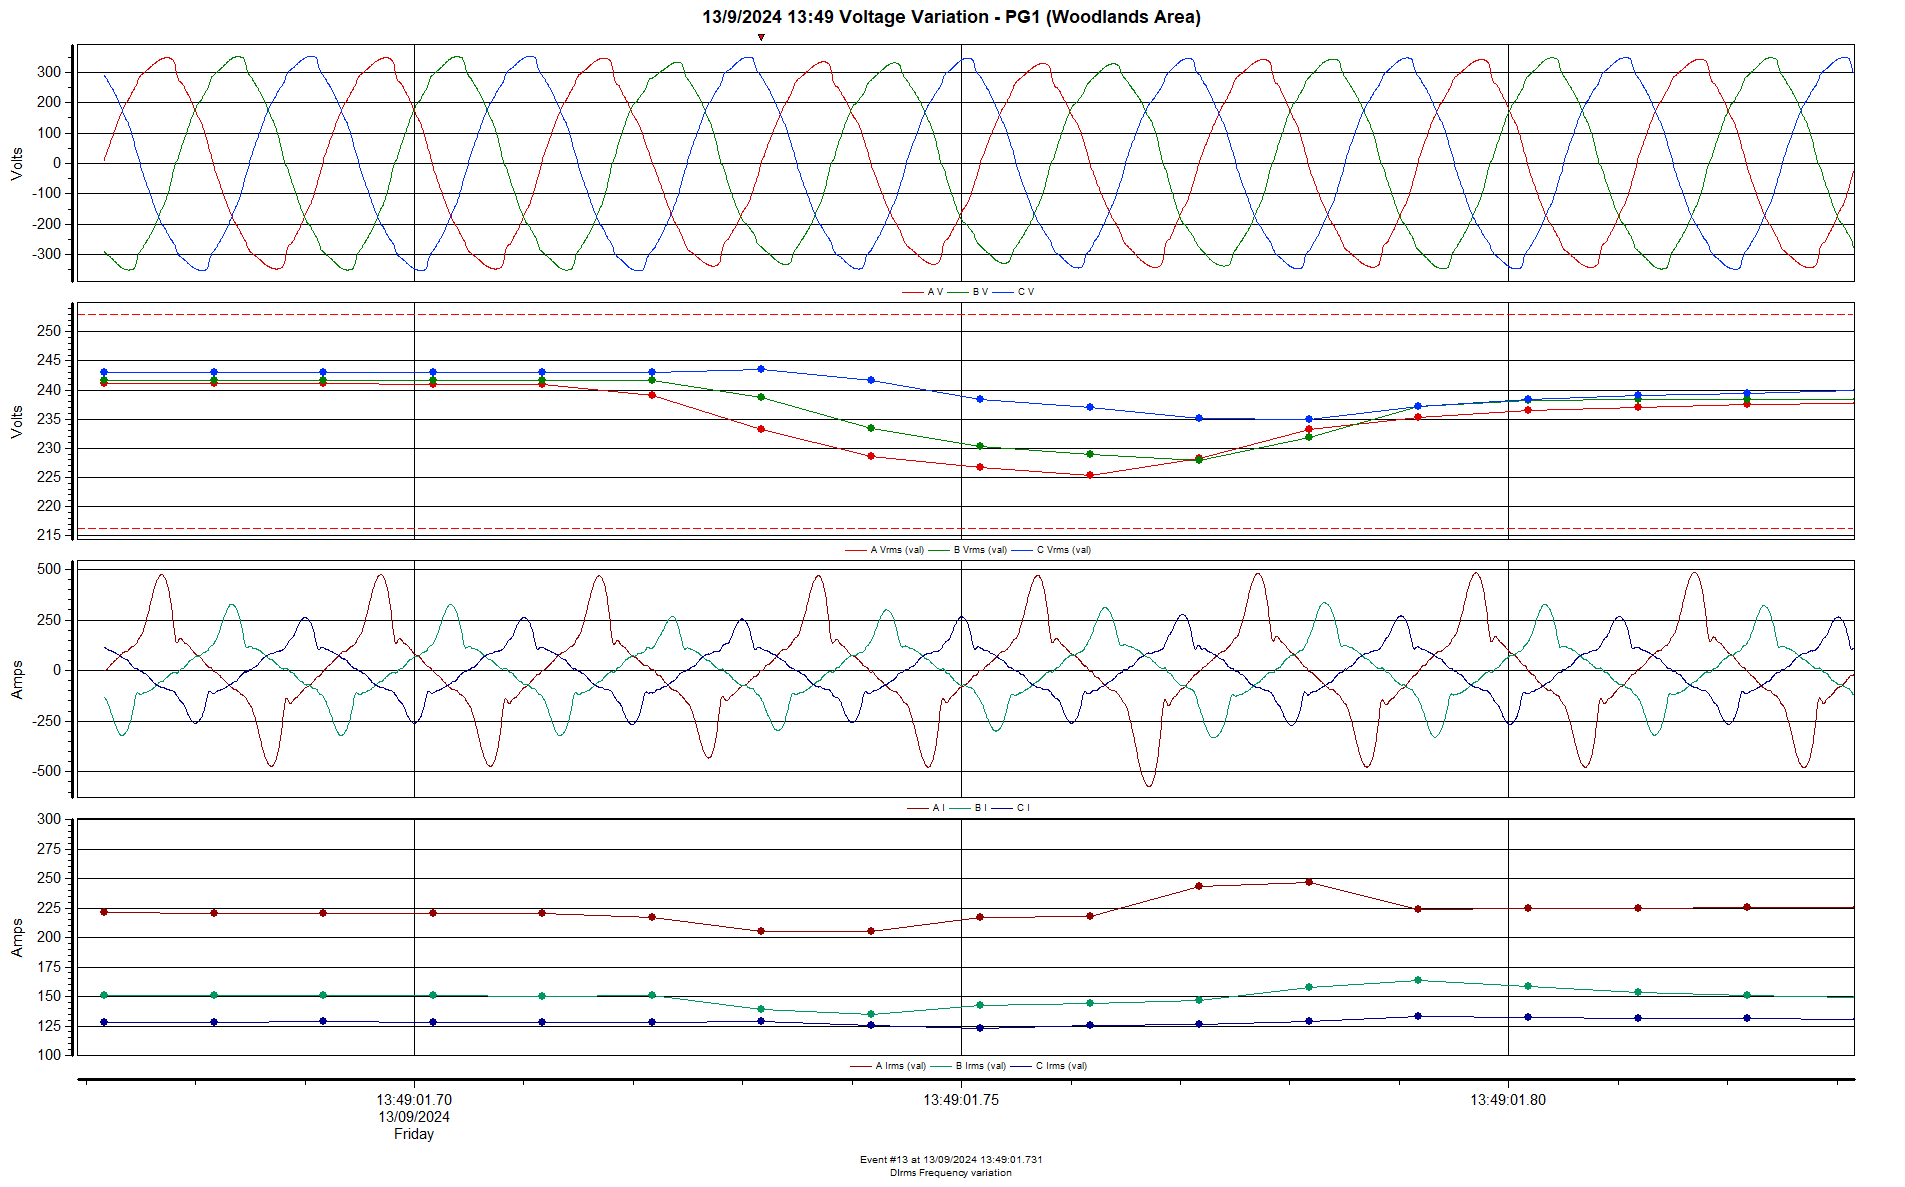
From another portable PQ analyzer that was monitoring in the northern area of Singapore.
From another portable power logger that was monitoring in the western area of Singapore
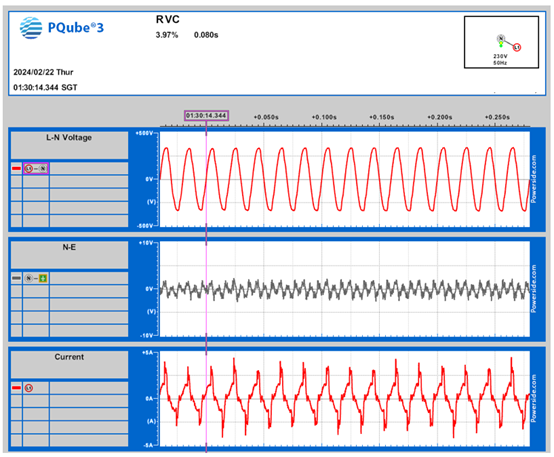
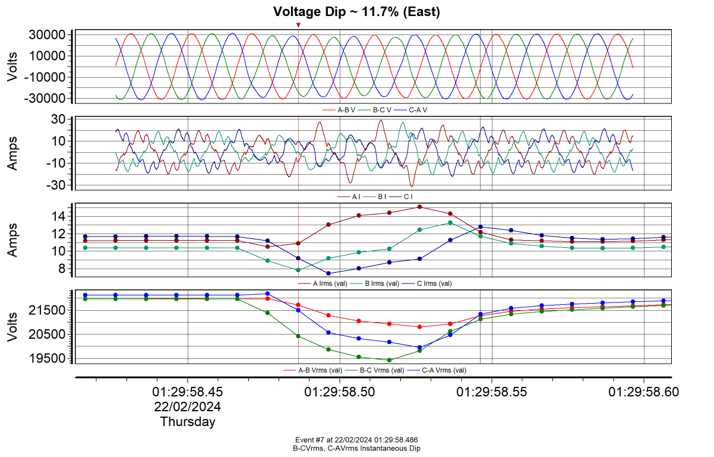
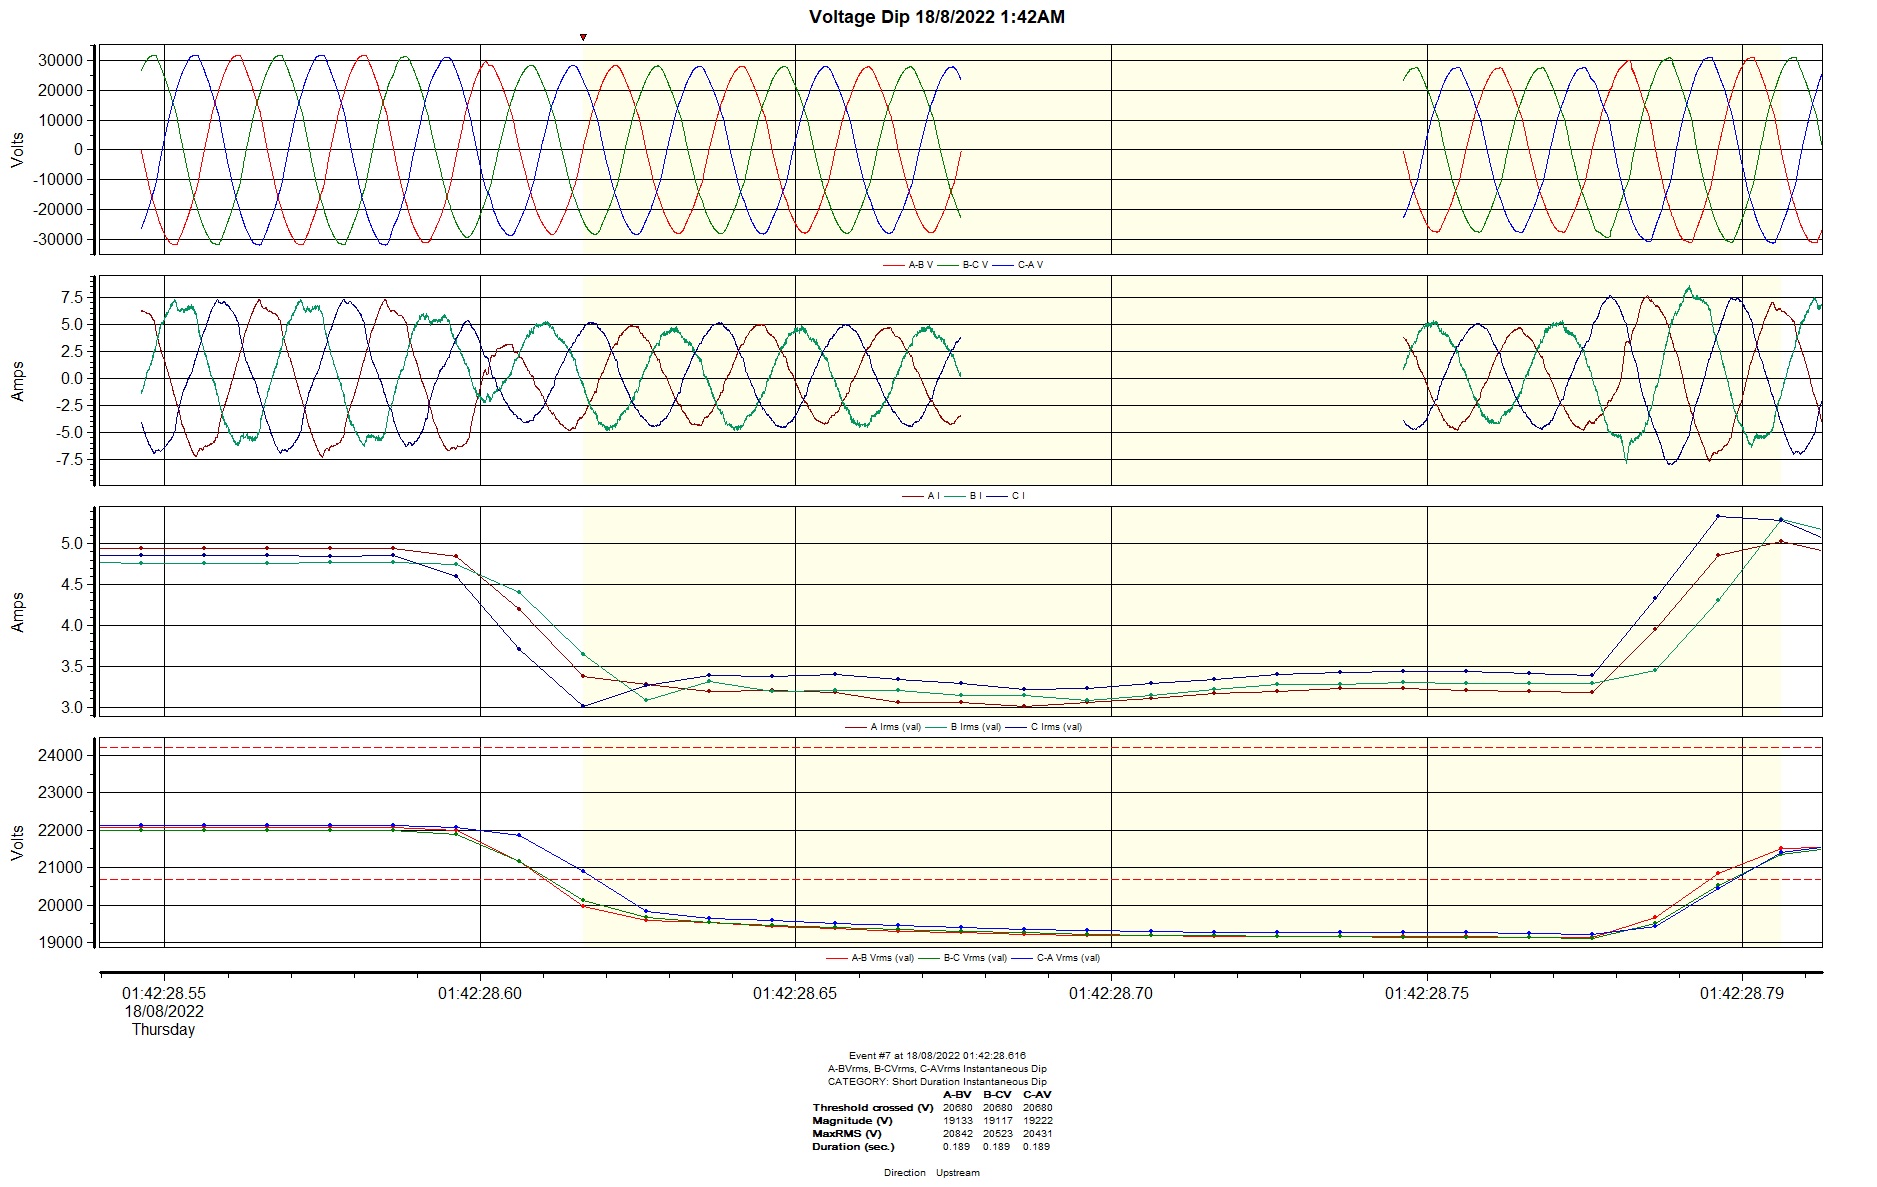
The PQUBE3 installed at my home’s incoming supply (230V Phase L3) detected an RVC (rapid voltage change) of 3.97% during the early morning of Thursday 22/02/2024.
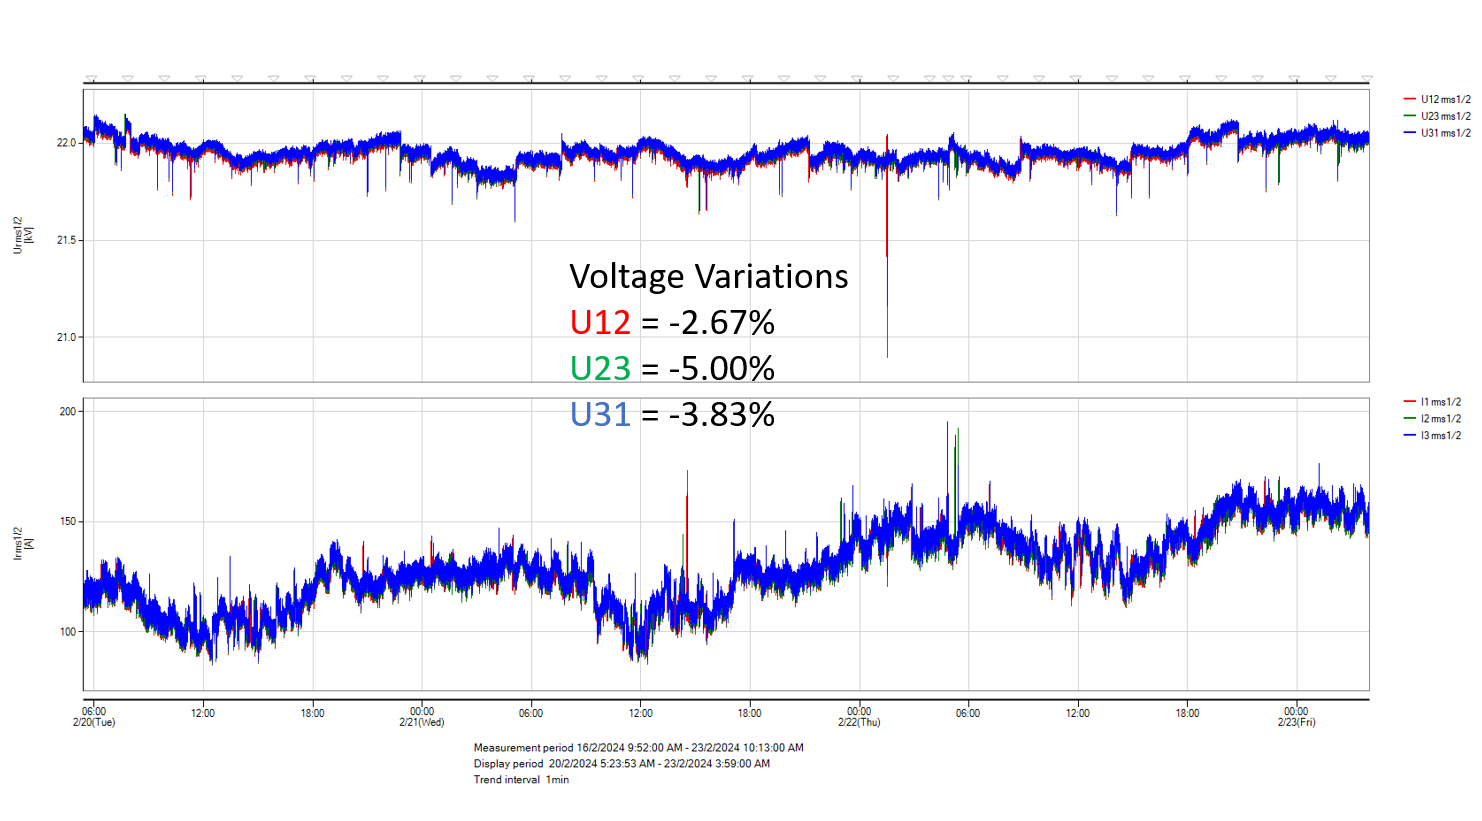
And today, while retrieving a portable PQ monitor from one of our worksites in Banyan Drive, I noticed the following voltage trends (occurred at about the same time as my PQUBE3 event). This was recorded at 22kV.
For these 2 locations (one on the mainland in the western part of Singapore, and another on Jurong Island), to have similar voltage variations suggest that a transmission level fault had occurred during the said date/time.
We have two other sets of portable PQ monitors, one in Loyang (east of Singapore) and another in Marsiling (north of Singapore) which will be due for data retrieval next week. These PQ monitors would have similar stories to tell.
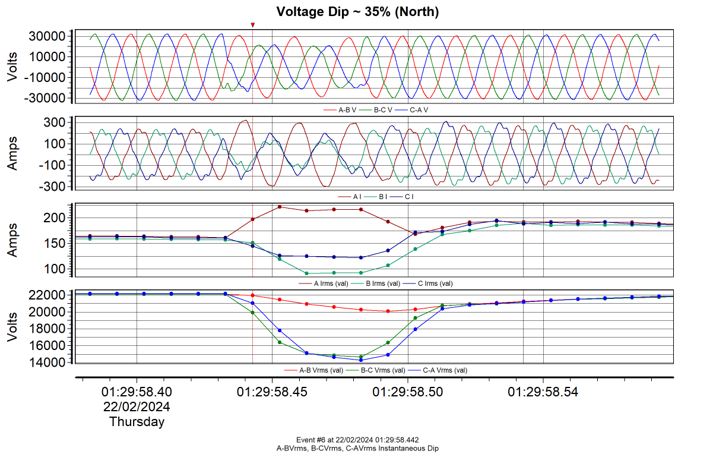
Updated – 28/2/2024
As expected, the other two set of portable PQ monitors captured the same event (at 22kV), with the PQ monitor at the northern part of Singapore saw the worst dip values, which was expected as the fault was made known to have originated from our northern neighbour (TNB – Malaysia).
Here, it can be deduced that it was a single-phase fault on the Blue phase (Phase L3).
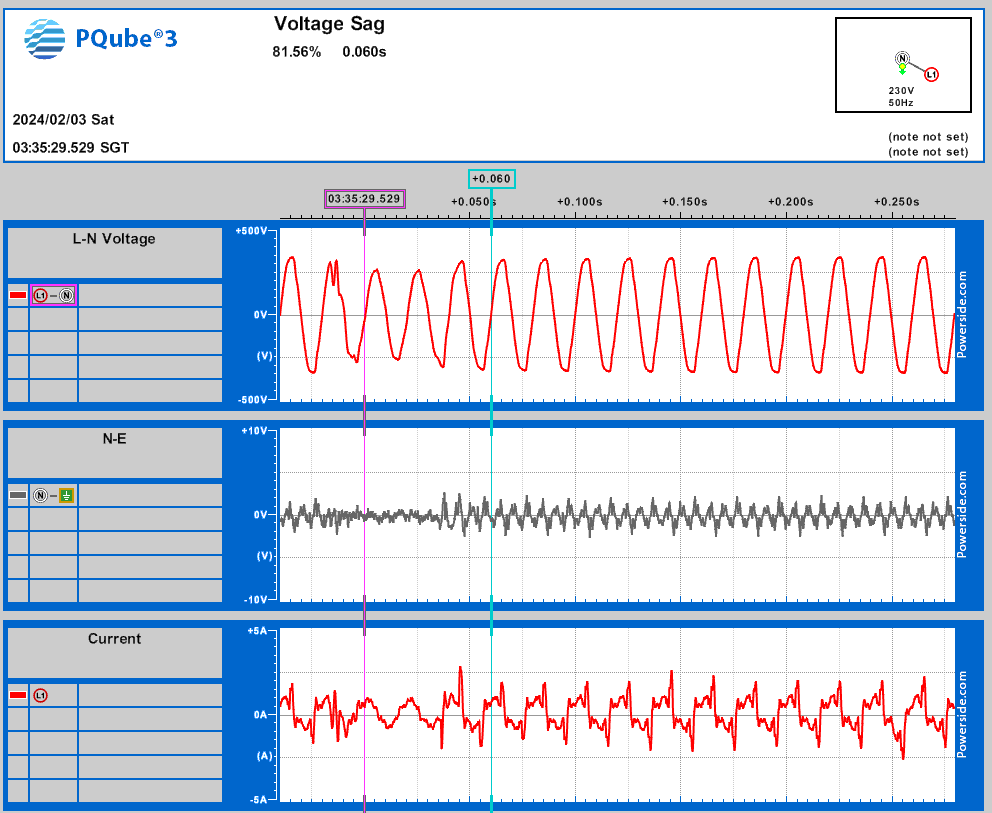
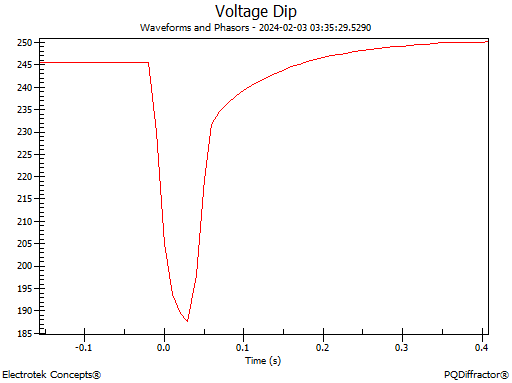
I had a PQUBE3 installed at my home’s incoming supply for about six months now and this was the first voltage dip (or sag) that it captured.
Apparently there was a transmission level cable fault in the Utility’s network. This would mean everyone in Singapore would have ‘seen’ it one way or another (in varying degrees, depending on locations).
My home (western part of Singapore) is taking in 230V single-phase supply (on Phase L3).
The PQUBE3 recorded a voltage dip of 18.44%, for a duration of 60ms (Lowest voltage was 187.6V).
In general, current harmonics contribution from solar PV inverters do not pose much of a power quality problem. Its ITHD is usually small and negligible as compared to a harmonics-producing load such as a variable speed drive (ITHD for a typical 6-pulse drive ranges between 30% – 50%).
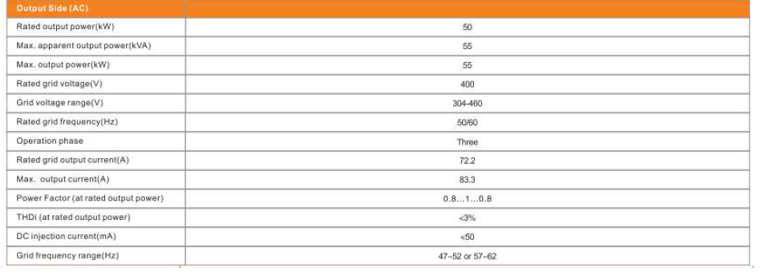
Typically, one will find a Current Total Harmonic Distortion of 3% stated in the datasheet for a quality-brand inverter, as seen here.
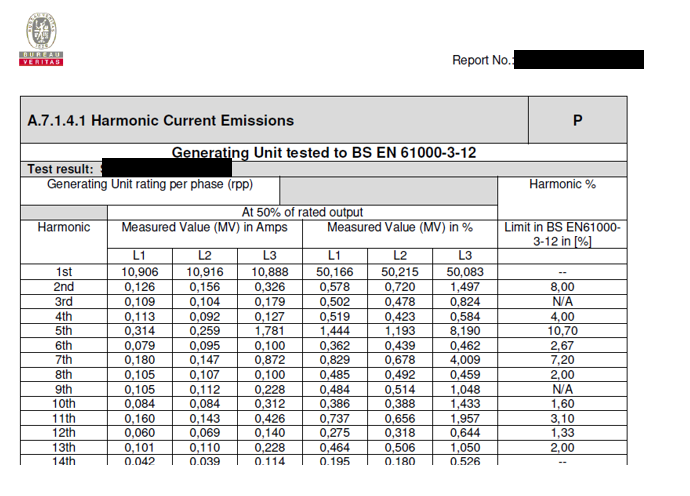
In Singapore, for a Grid-Tied Solar PV connection, the Licensed Electrical Worker (LEW) (i.e Qualified Person) will have to submit the inverter’s PQ-related type test report to the Grid operator (SP Group). Below is one such example – here it shows the portion whereby the inverter was tested as part of the UK Engineering Recommendation G99 test requirements. Values stated for quality-brand inverters will have its harmonic current emission values well within the limits.
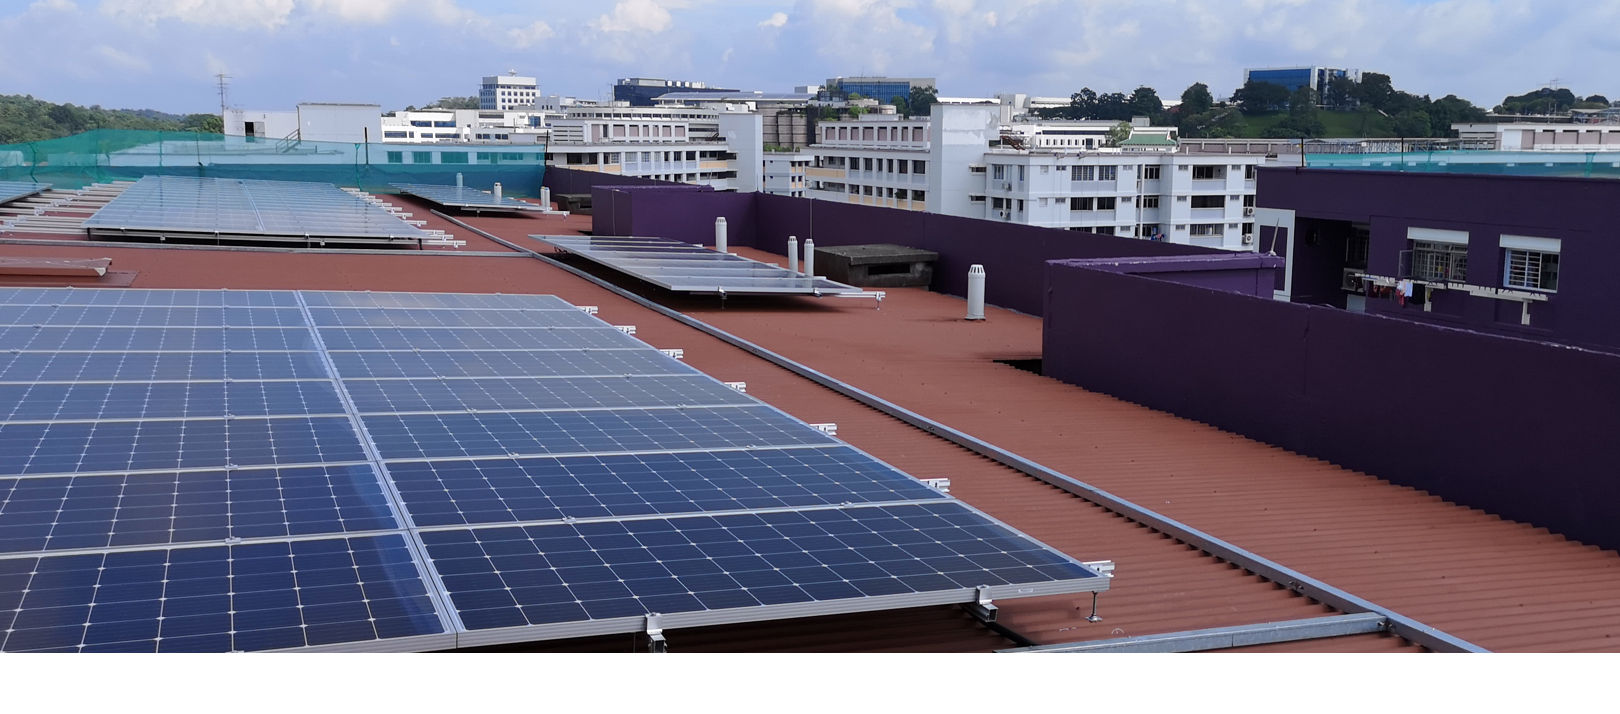
You may wonder – One inverter is ok but how about a number of them accumulatively? I had the opportunity to measure numerous sites whereby the rated PV output was accumulatively more than 1MWac.
Here are two sites whereby the background harmonics can be considered to be on the low side and as such the effects of the on-site inverters were more representative (limited ‘contributions’ from the localized electrical network).
All measurements were done using an IEC 61000-4-30 Class A certified Power Quality instruments.
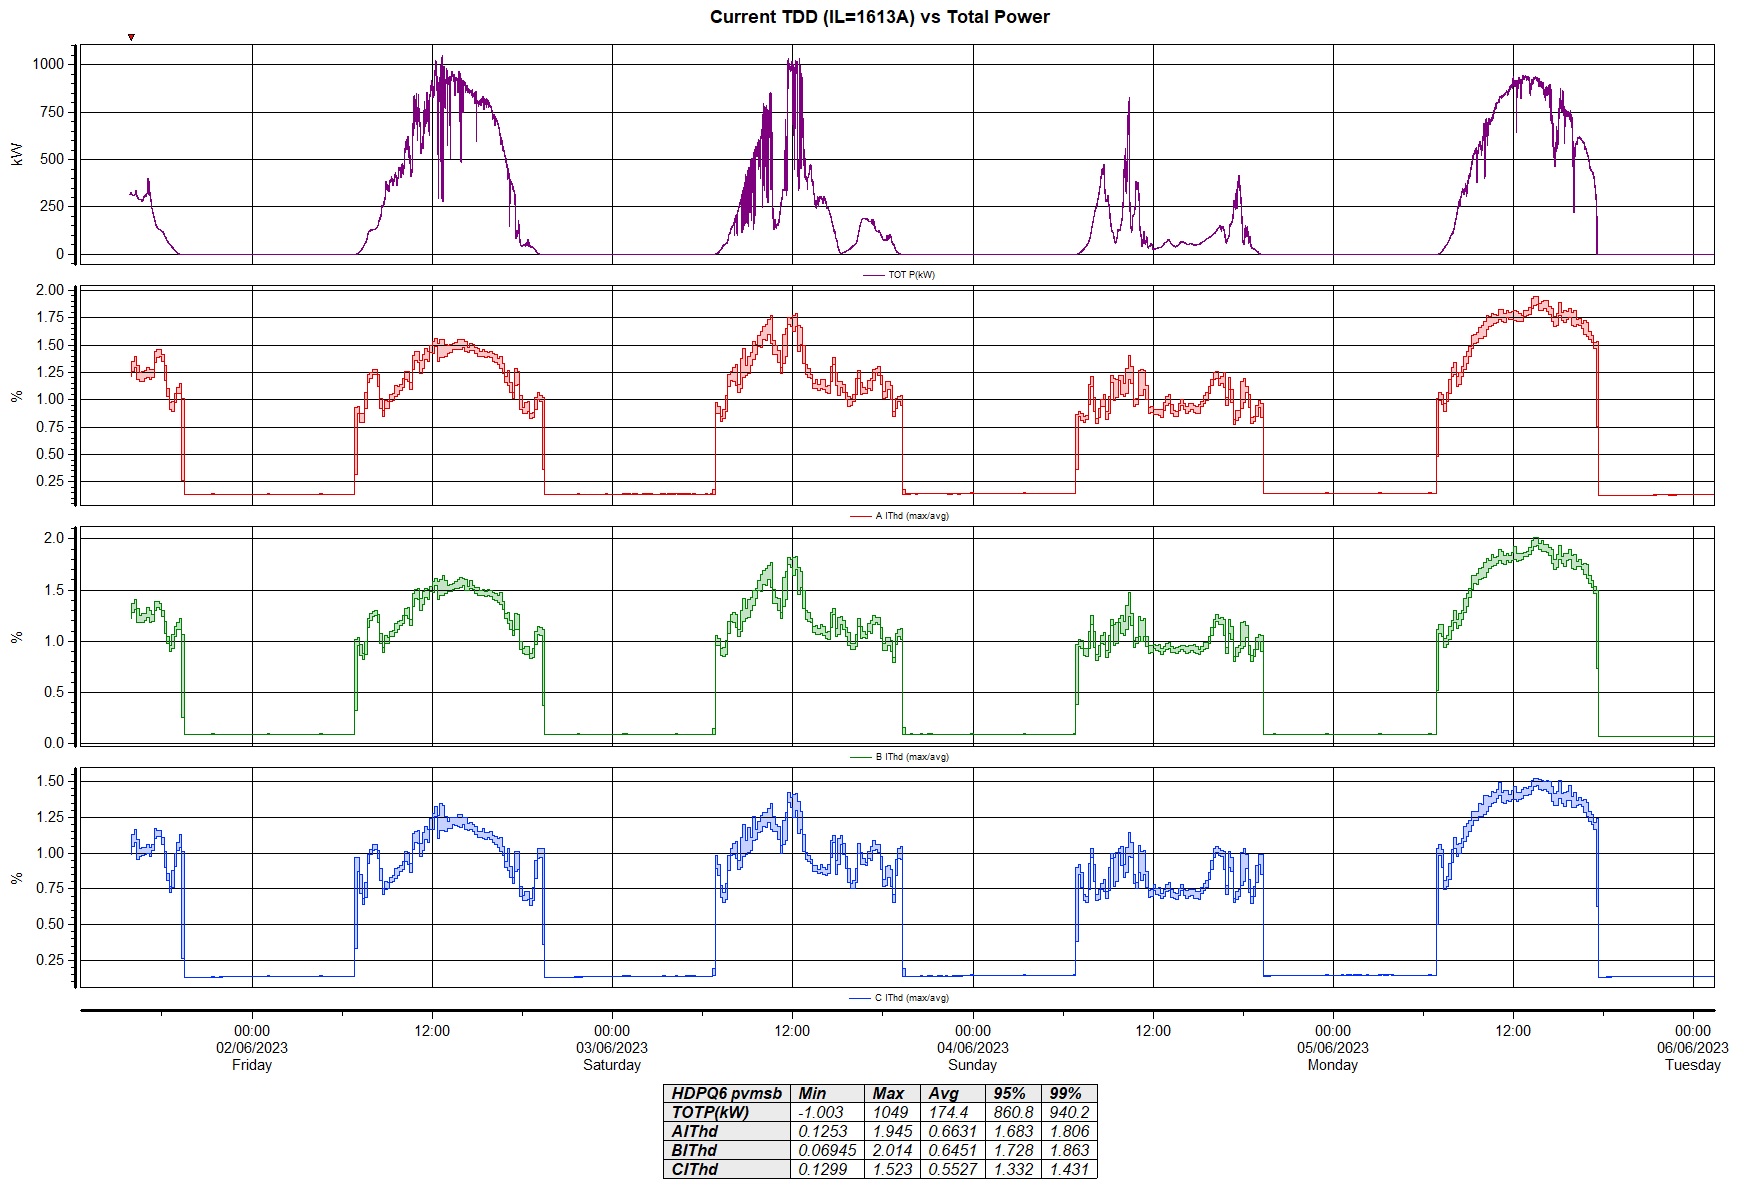
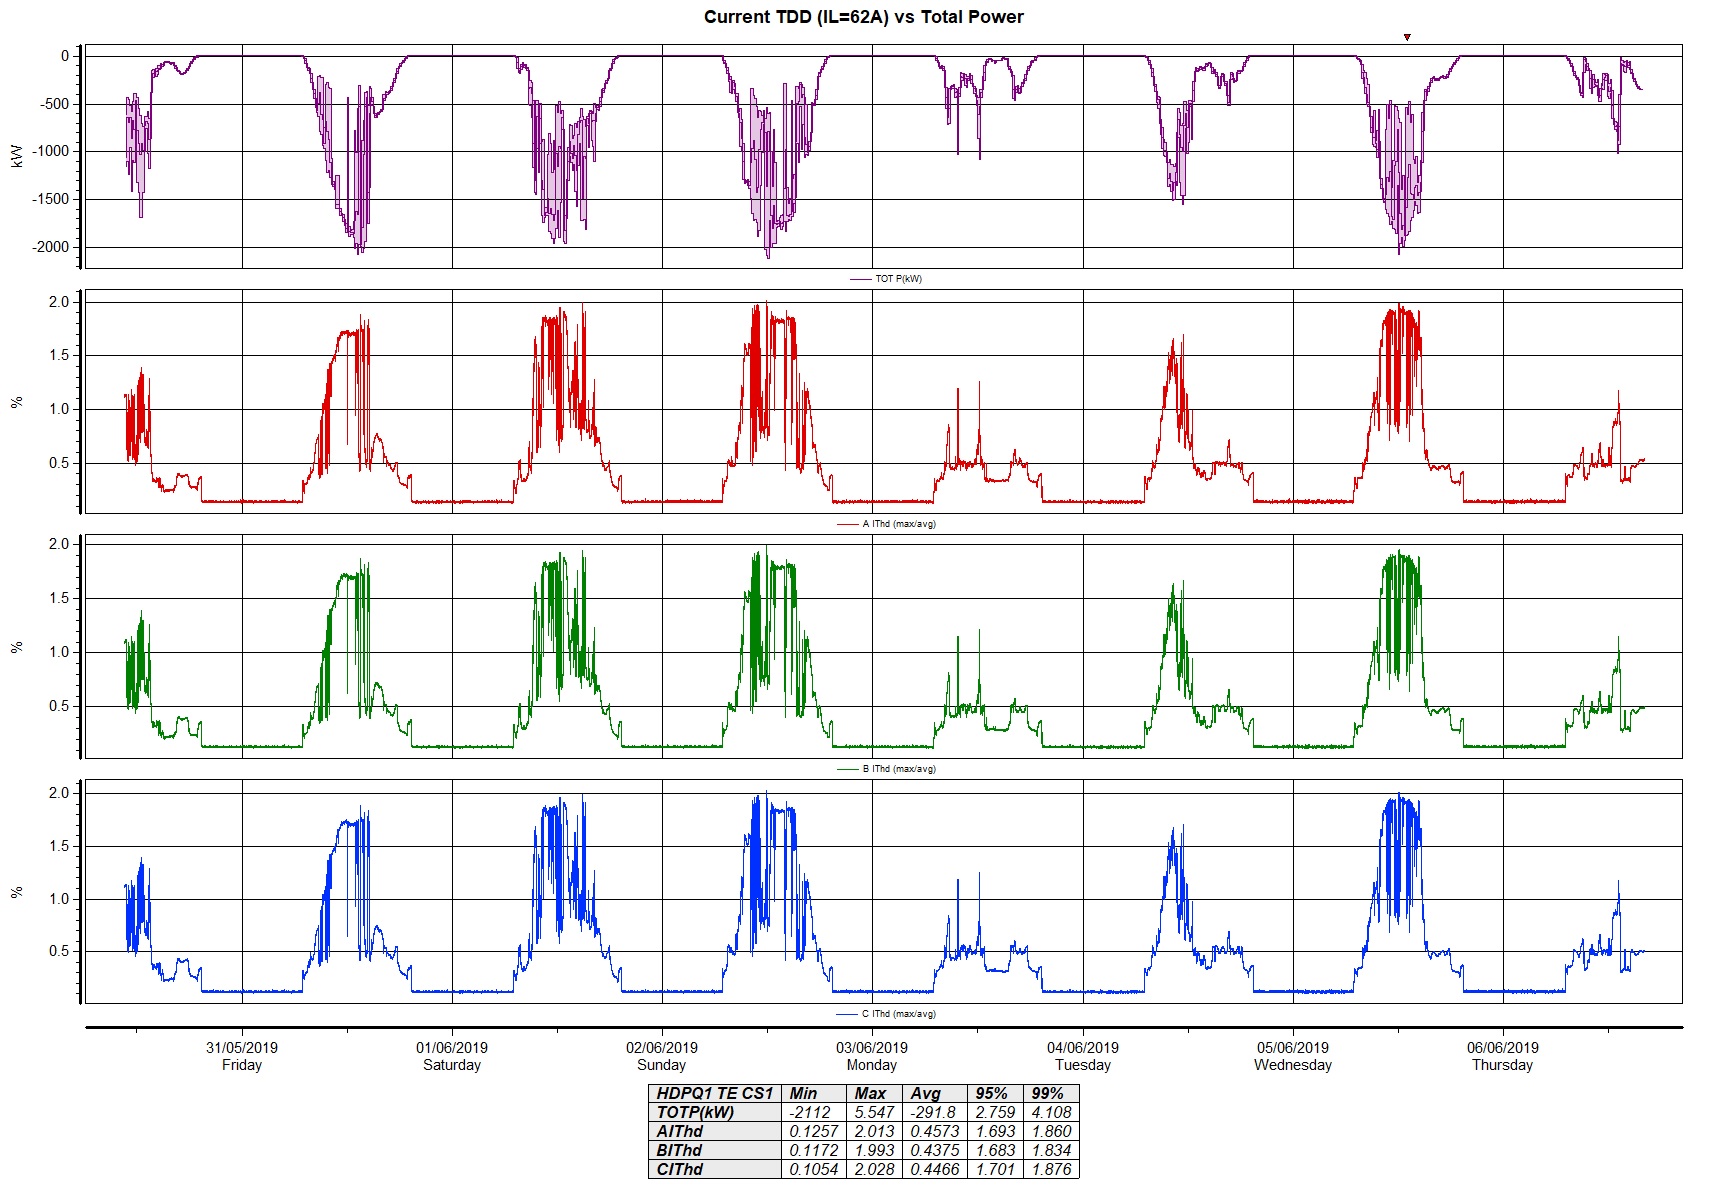
The Current Harmonic Distortion (ITHD) in the trends below have been scaled to the respective aggregated inverters’ rated current (in other words, shown here as Total Demand Distortion (TDD) values).
As observed here, the TDD values were less than 3% and the sinusoidal shape of the current waveforms were very much still visible.
Note: IEEE 519 recommends TDD values of 5% for power generation facilities.
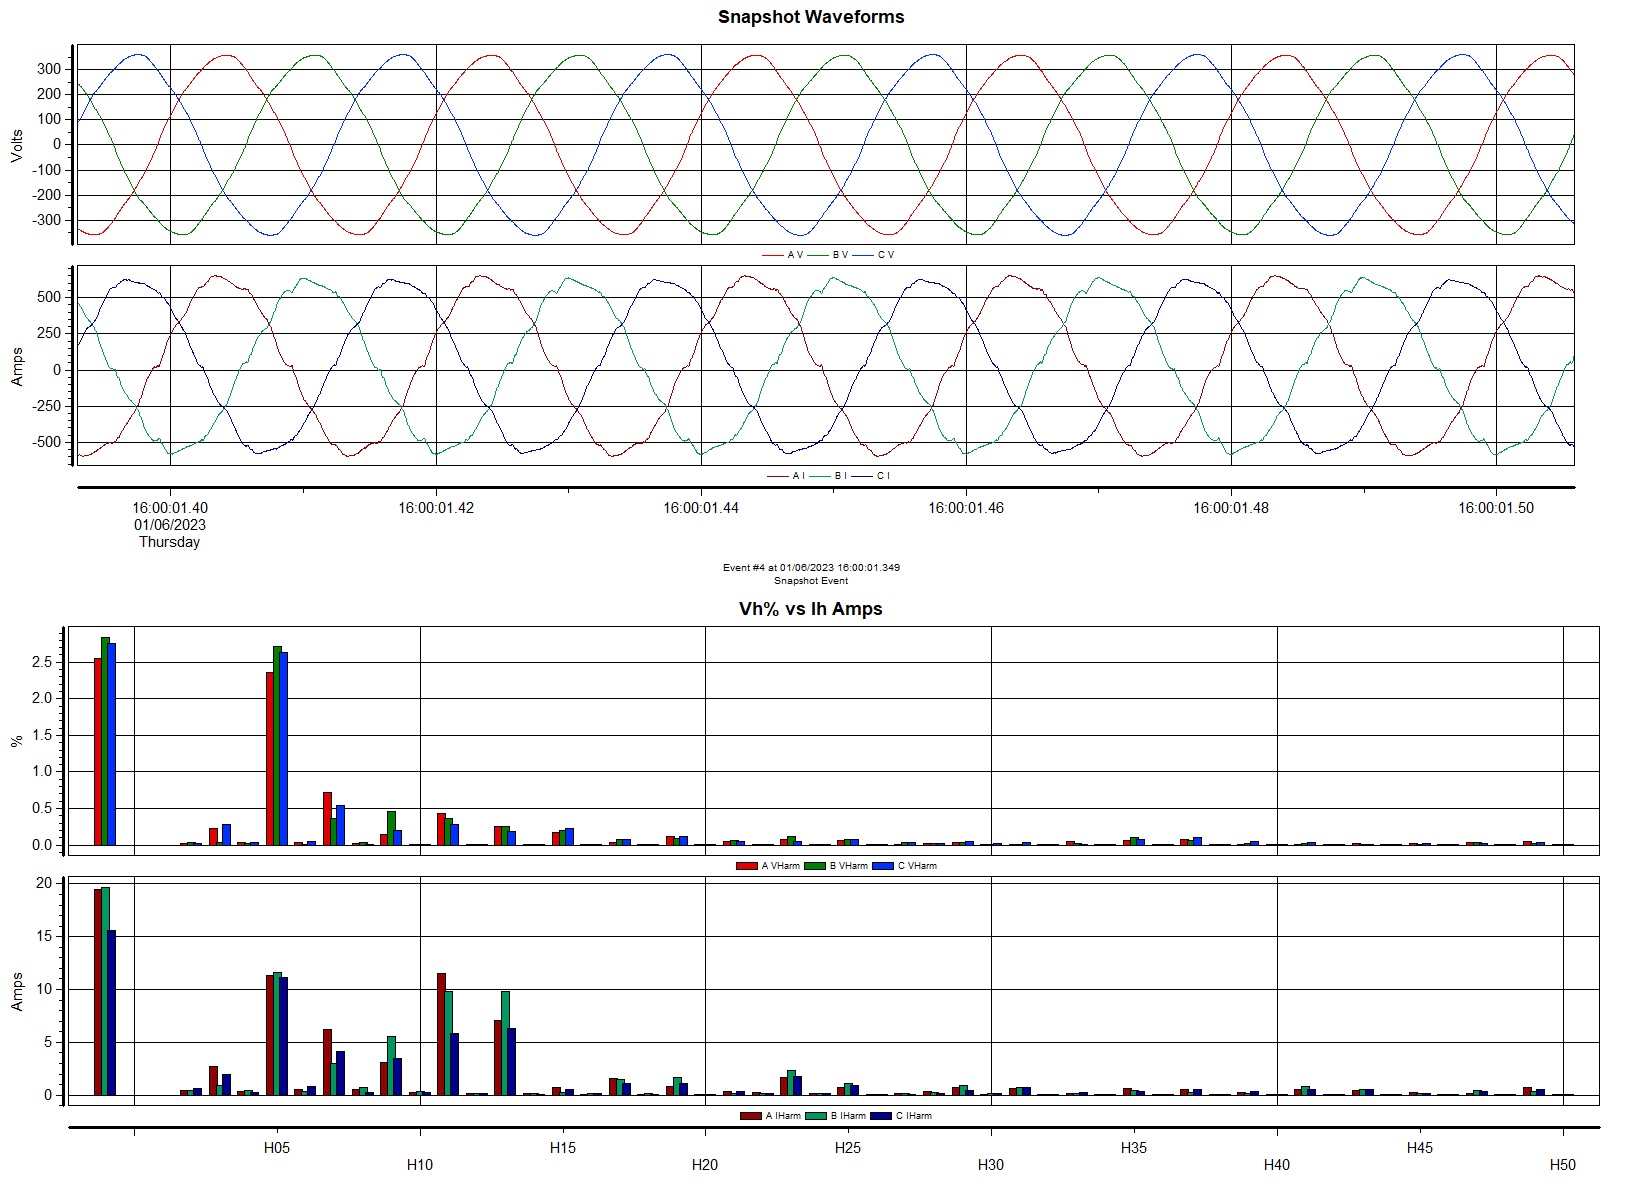
Site #1:
Premises Type: Warehousing / logistics PV Size: 1352.8 kWp Aggregated Inverter(s) Rated Current = 1613A @ 400V. Measurement Point: 2500A PV-AC DB, directly connected to the Premises 5000A Main Switchboard (served by a 3MVA transformer) via 3000A flexible CTs (clamped on 3 sets of 500sqmm cables per phase). CT direction towards MSB as Load, PV as Source. VTHD: 0.89% – 3.96% (CP95: 3.6%).
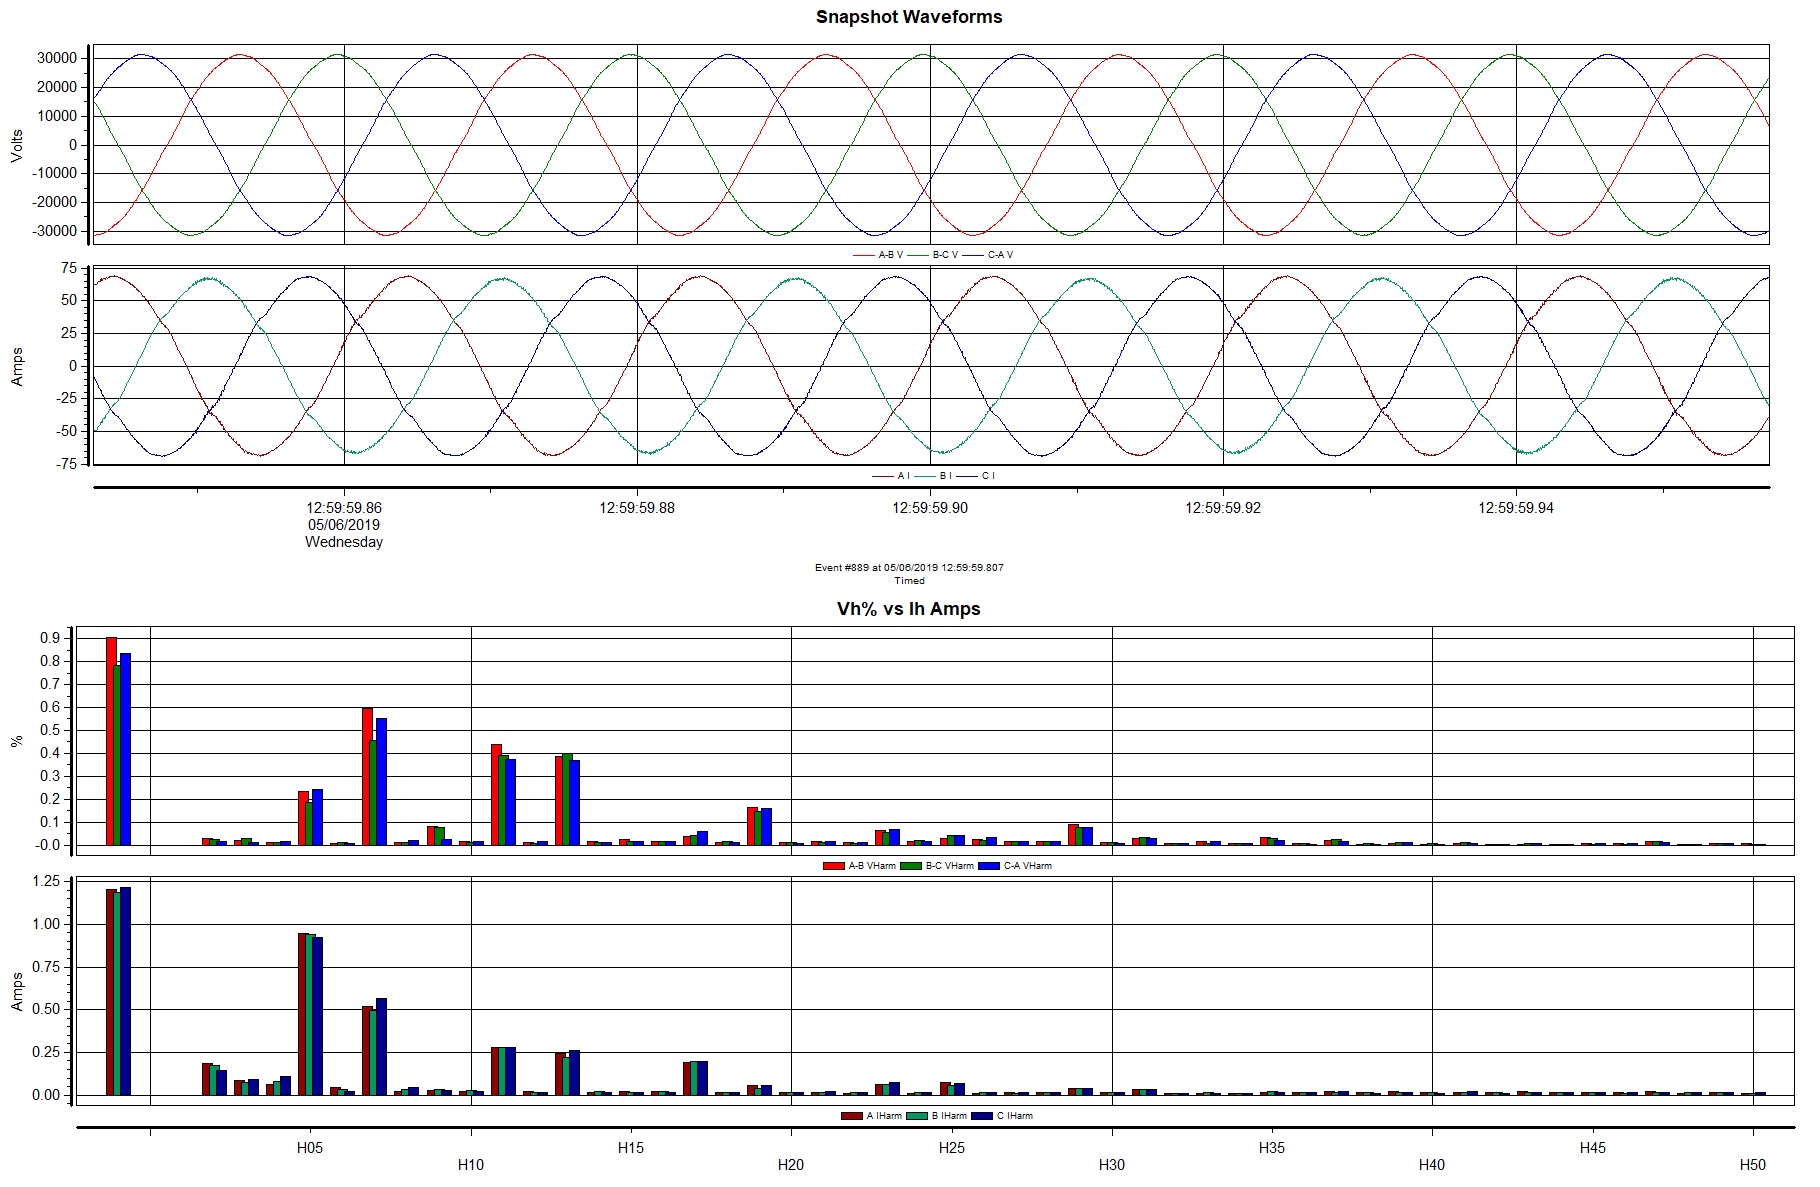
Site #2:
Premises Type: Solar Farm (On-site loads: Auxiliary power and lighting loads only) PV Size: 2652kWp (for CS1) Aggregated Inverter(s) Rated Current = 62A @ 22kV (for CS1). Solar inverters connected at 400V, stepped-up to 22kV via a 2.5MVA transformer. Measurement Point: 22kV Incomer 1 from PowerGrid (CS1) via VT and CT. Note: Solar Farm has 2 x 22kV intakes from PowerGrid – only one intake shown here. CT direction towards PV as Load. Solar Farm was connected to a Lightly-loaded 22kV distribution network. VTHD: 0.59% – 1.22% (CP95: 1.09%).
On 12 May 2023, the regulator Energy Market Authority (EMA) issued a circular that w.e.f 1/7/2023, all residential premises will be required to have a Residual Current Circuit Breaker (RCCB) installed. A two-year grace period is given. This circular was targeted to homes built in or before July 1985, as this RCCB requirement is already been in place since 1 July 1985.
Finer Points of this RCCB requirement
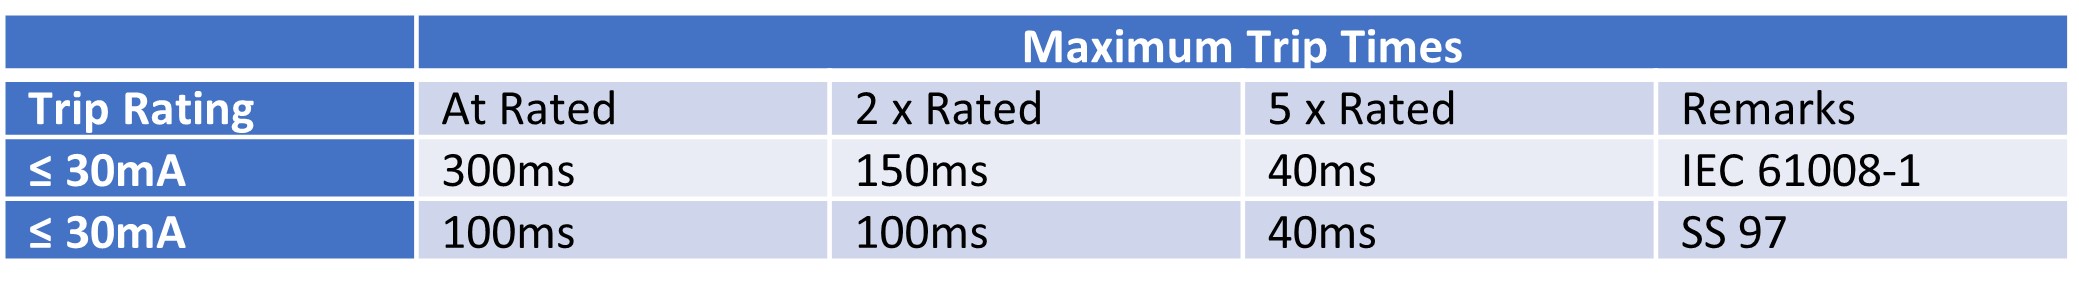
1. It refers to the 30mA sensitivity RCCB, meant for protection of socket outlets and lighting circuits.
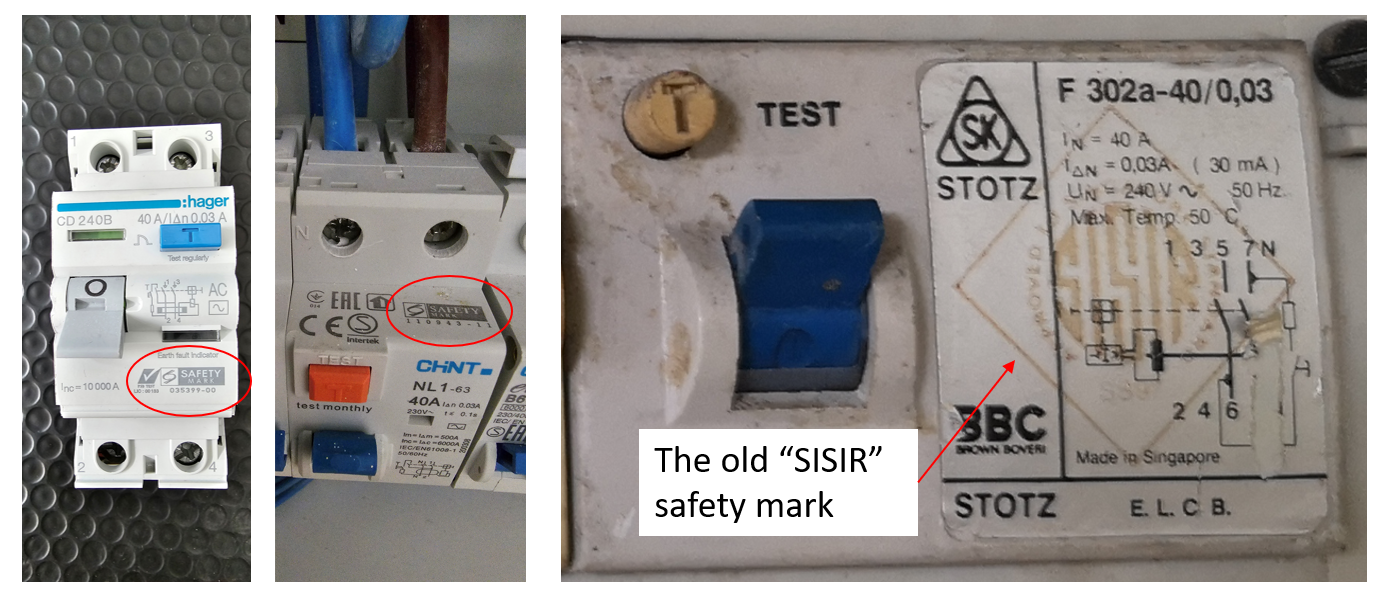
2. The 30mA RCCB is a “Controlled Item”. In short, one should look out for the “Safety Mark”. Refer to Enterprise Singapore website for more details.
30mA RCCBs and older ELCB
3. 30mA RCCB used in Singapore has a faster tripping time, as compared to the IEC Standard. One can refer to Singapore Standard SS97 (Residual current operated circuit-breakers without integral overcurrent protection for household and similar uses (RCCBs) – General rules) for details.
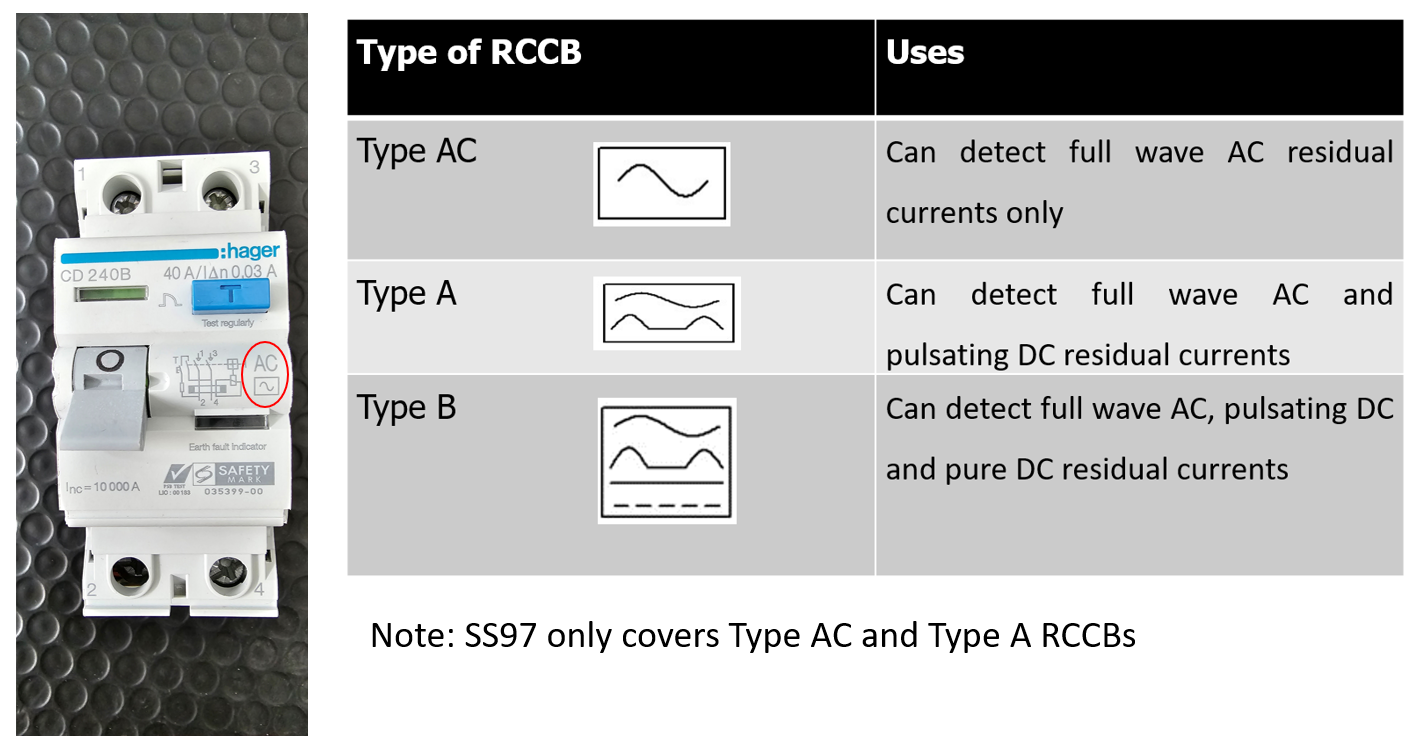
Note: SS97 covers both Type A and Type AC RCCBs.
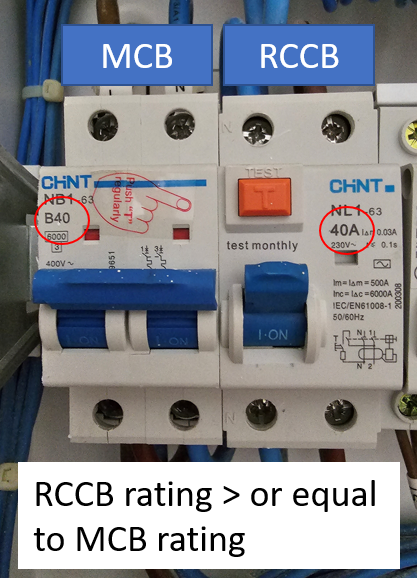
4. The RCCB has no overcurrent/overload protection. Hence it is important to ensure that there is a corresponding circuit breaker protecting it against overcurrent/overload. The 30mA RCCB comes in few typical ratings, 25A-40A-63A-80A-100A. One needs to ensure that the RCCB rating is higher or equal to its corresponding circuit breaker. In this example here, the 30mA RCCB is rated 40A, equal to the circuit breaker rating of 40A.
RCCB rating has to be greater or equal to MCB rating
Power Quality Tips for RCCB Selection
The 30mA RCCB is highly sensitive and can lead to cases of maltrip/nuisance trip. An RCCB is designed to trip anywhere above 50% of its sensitivity rating (For the 30mA RCCB, it may trip anywhere above 15mA). Below are couple of tips to follow, if you have been experiencing nuisance RCCB trip(s) with no clear fault/causes found.
1) One should not lump many circuits/appliances to one RCCB. Typically, for a HDB flat, 1 RCCB will suffice. But for larger homes, one may need multiple RCCBs.
The rule of thumb is to limit the standing/background leakage current to 20-25% of the RCCB sensitivity. If this is exceeded, additional RCCB(s) will need to be installed (eg. instead of 1 RCCB serving 10 circuits; re-wire 1 RCCB each to serve 5 circuits; total 2 RCCBs).
Note: Every equipment / appliance contributes a small amount of leakage current (from its mains filter etc).
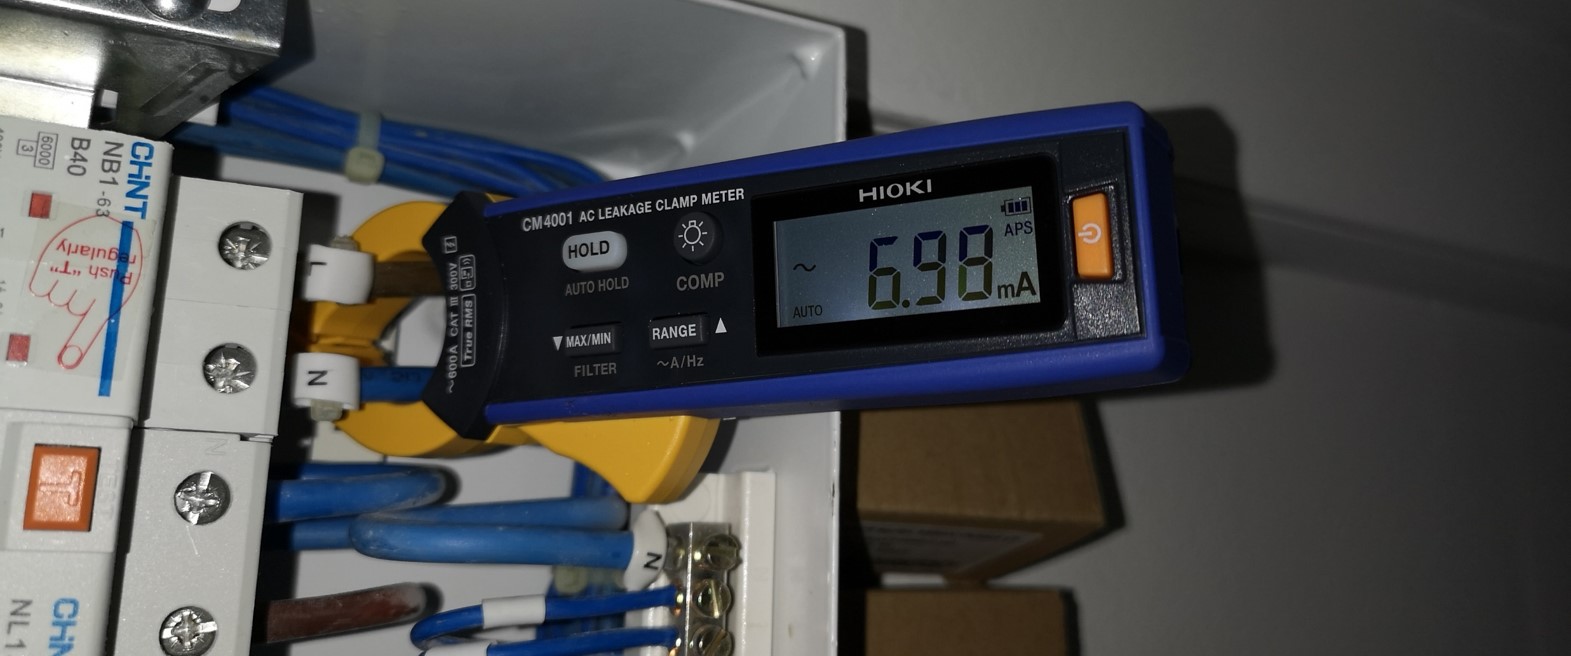
Use a Leakage Clamp – Clamp on both Live and Neutral cables
2) The RCCB type should match the load(s) type. A mismatch has been known to cause both maltrip and non-trip cases.
RCCB Types – Type AC most common in Singapore homes
Locally, it is being accepted that for typical residential power and lighting loads, the Type AC RCCB suffices. The price difference between a Type A and Type AC can be as much as 10x. Hence, it is rare to ever find a ‘Type A’ RCCB in homes. The type of RCCB can be differentiated from the ‘waveform logo’ on the RCCB itself, as circled in the photo above.
Loads today however are rarely sinusoidal in shape (as per the AC waveform seen). Here is a voltage/current waveform snapshot of my own home. The current waveform is on the right. It hardly looks sinusoidal.
Note: Some European countries have banned on the general use of Type AC RCCB.
Last week, two of our portable PQ analyzers captured a voltage dip of about 13% (at 22kV) lasting almost 200ms. It was made known later that it was due to a fault in the Tuas South area.
Our PQ analyzers were in the Tuas West Drive area.
Based on experience, for a voltage dip of about 10 to 20% to be seen in another 22kV network, it will need to be a significant fault causing a voltage dip in the range of 80 – 90% in the fault area (Tuas South).
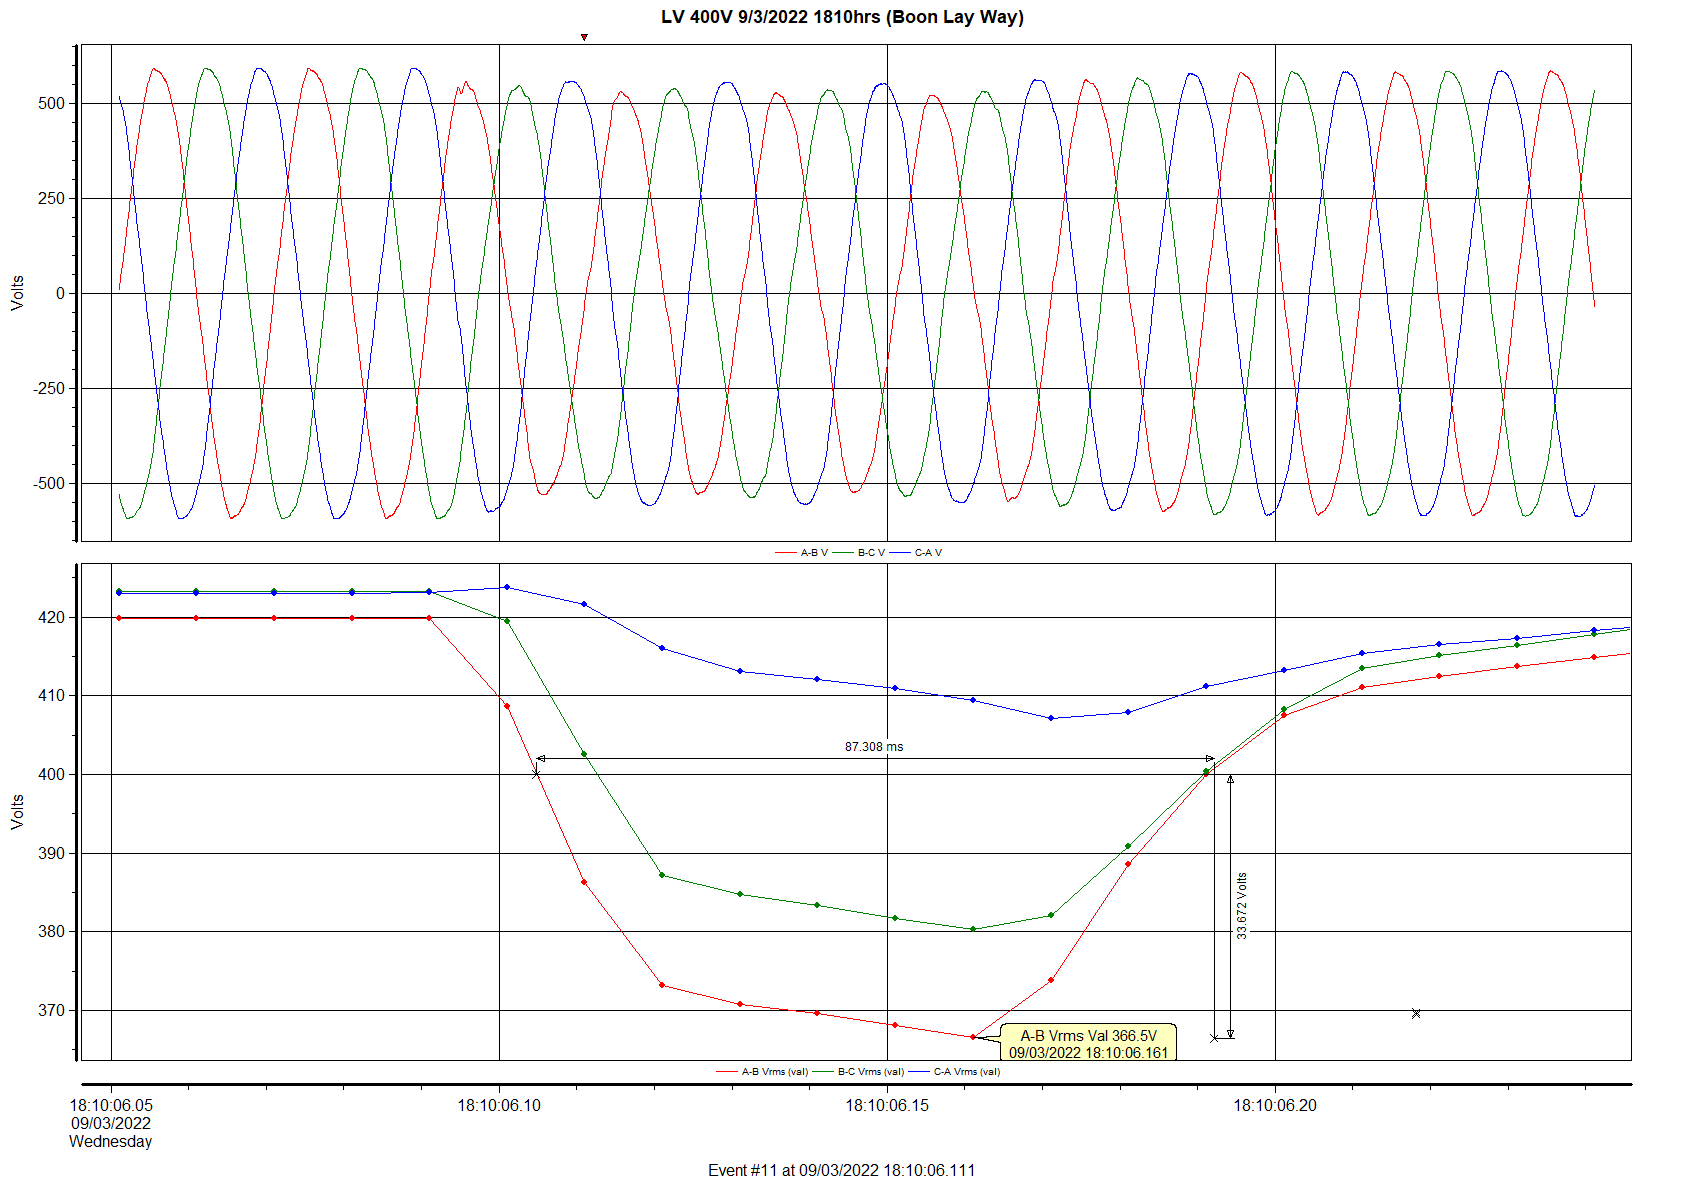
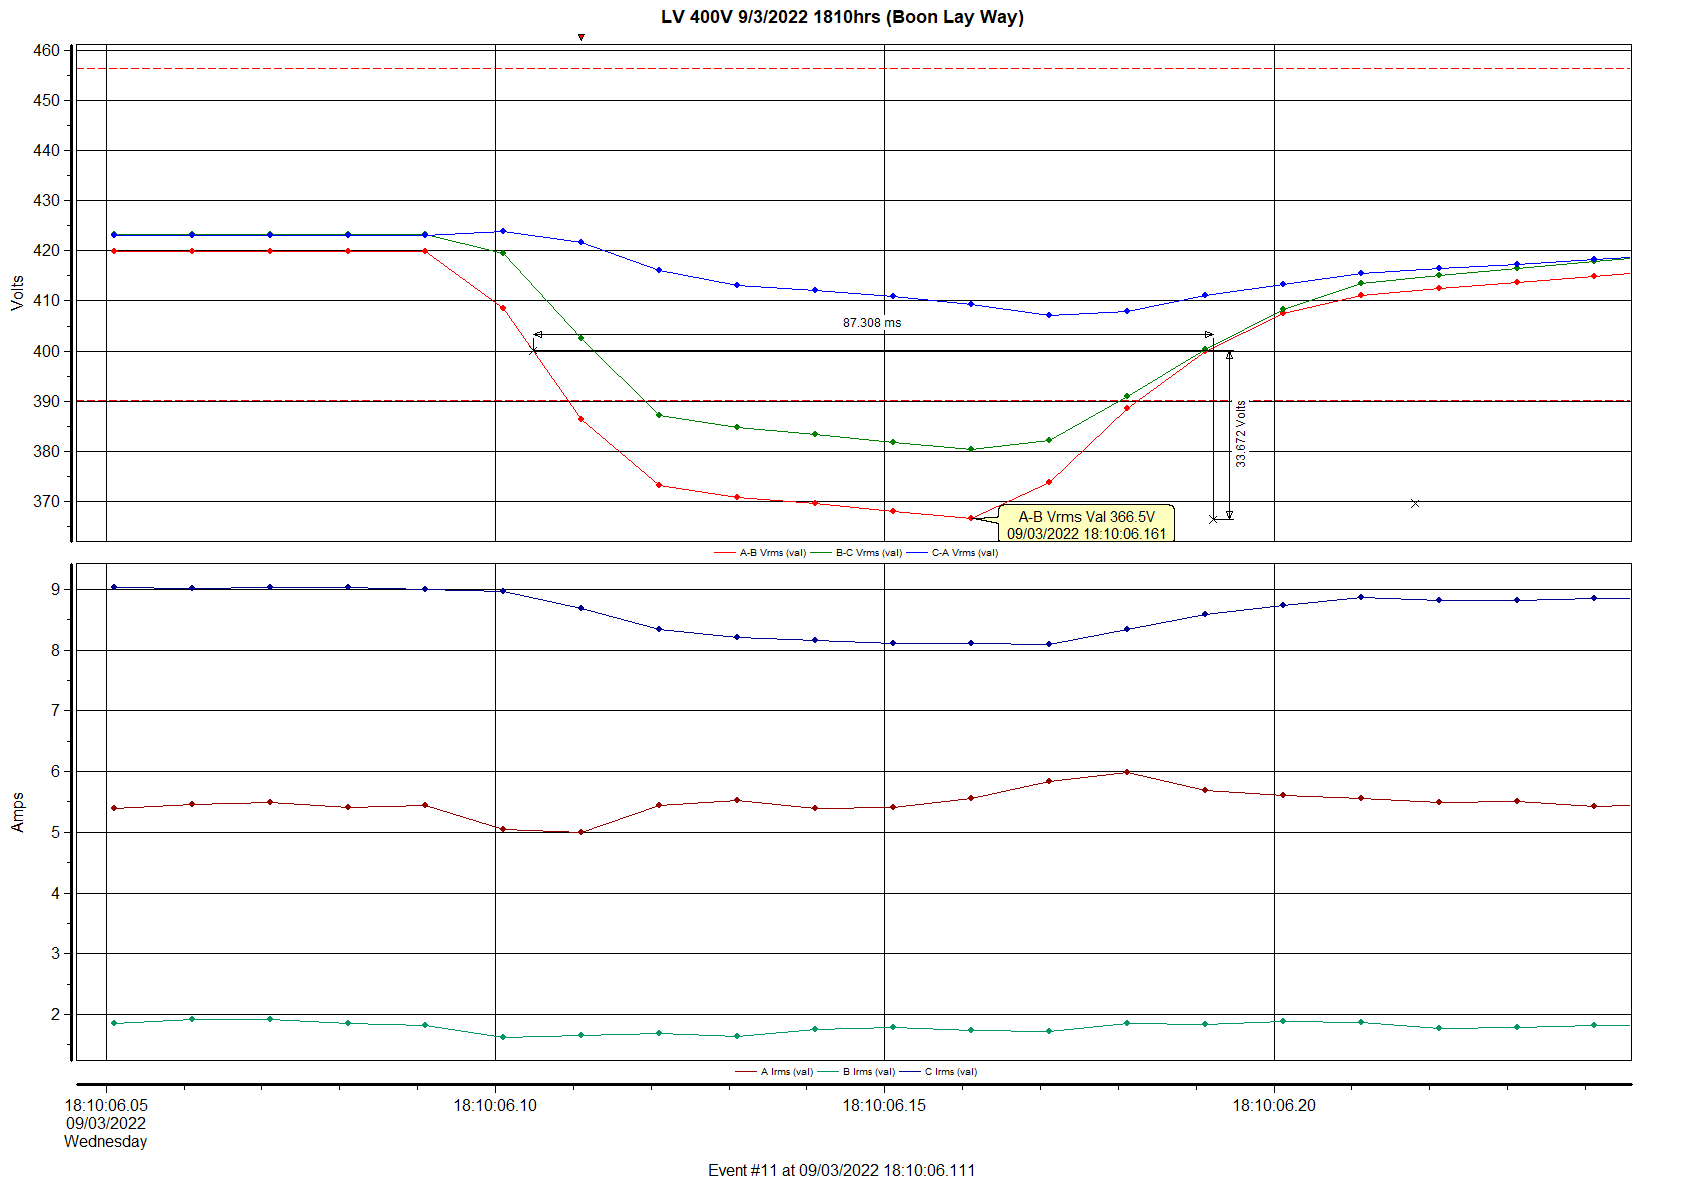
A voltage dip was reported in the Jurong-Pioneer area at around 6:10PM, due to a 22kV cable fault.
Our office, a 15-20mins drive away (Jurong East – Boon Lay Way) recorded a drop in voltages of about 13% (from 420V to 366.5V) or about 8% (if referred to nominal voltage of 400V), as seen below.
Measured at 400V (Line to Line)
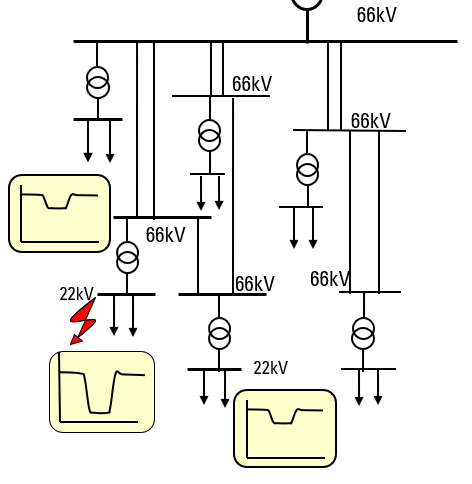
One may wonder how could a fault in Pioneer area affects the voltages in Jurong East?
Our local distribution grid is densely interconnected, resulting in a high-reliability electricity network. Total blackouts are rare. But interconnectivity brings about a small disadvantage. Any fault will be seen/felt (in the form of a voltage dip) by everyone who is connected. The seriousness of this dip will be dependent on the types of faults and the electrical distance between you and the fault point.
Based on past experiences, for a voltage disturbance of about -10% to be seen at another 22kV network, it will need to be a significant fault causing a voltage dip in the range of 70-80% in the fault area.
Our office is in another 22kV network, which is connected to the fault area via the 66kV network path, as illustrated below.
Such drop in voltages usually do not cause much problem(s) to the equipment-end (especially typical office loads), as observed in the following Irms trends during this voltage disturbance.
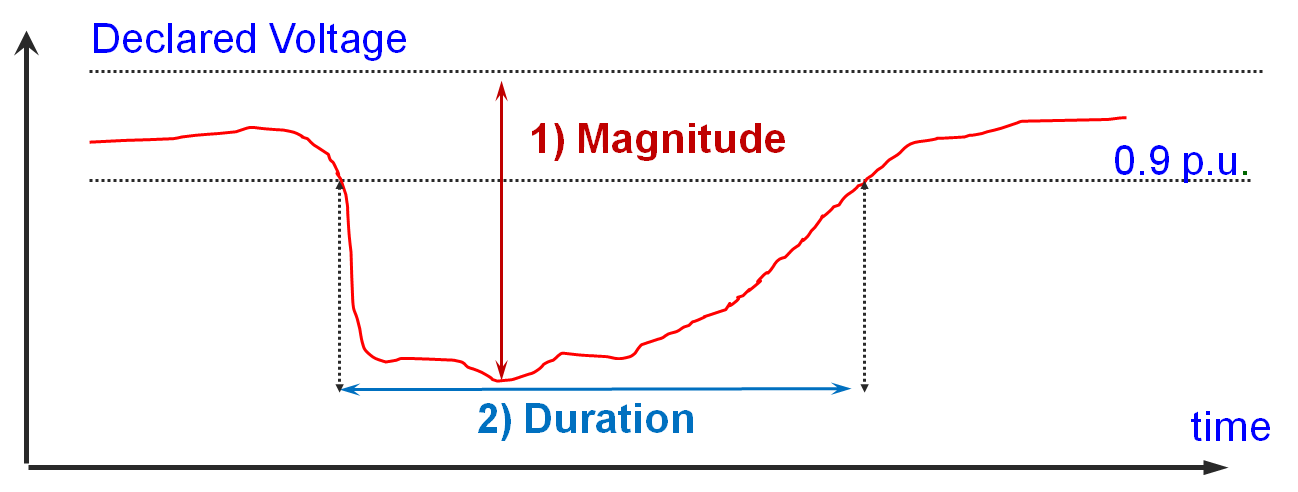
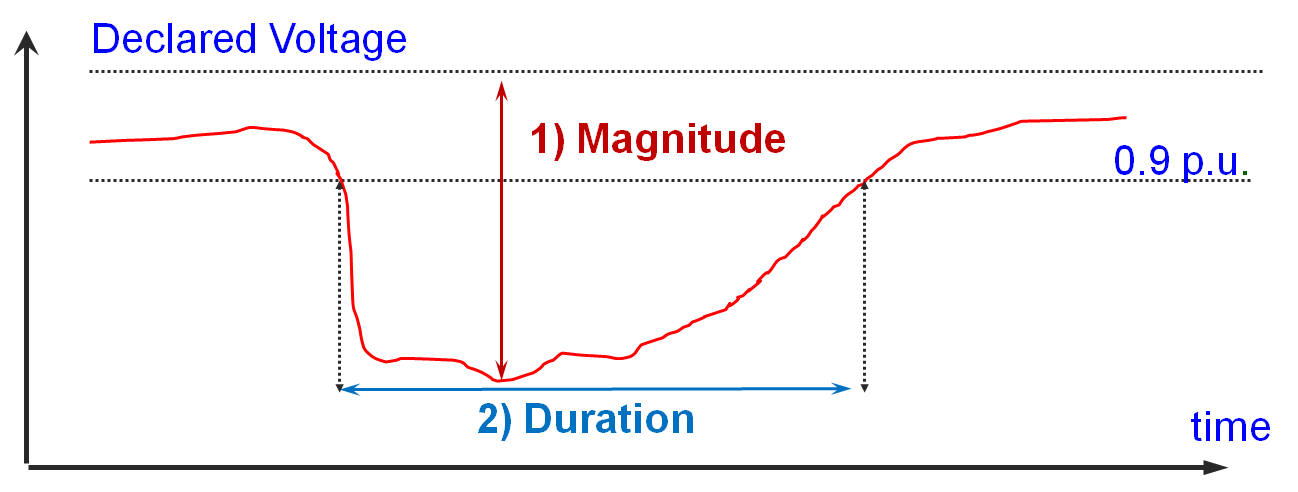
What happens if a voltage dip occurred, and for some reason(s), you had not set the PQ analyzer to capture it or that the PQ analyzer had ran out of memory for capturing of events? (Note: some brands of PQ analyzer do have a limitation on how much event(s) it can record).
The short answer is that you will not be able to get detailed waveforms (and trend) of that particular event. Hence, information such as how long was the dip would not be known.
But not to worry. Not all is lost. You will still be able to get the lowest (minimum) RMS voltage(s) recorded. Depending on the brand/model/software used, one will need to plot out the ‘per-cycle’ RMS voltage minimum trends.
Dranetz, for instance has incorporated these per-cycle trends automatically in their voltage/current trends. So the minimum/maximum value(s) that one see on a Drantez voltage/current RMS trend is really the lowest and highest value(s) recorded.
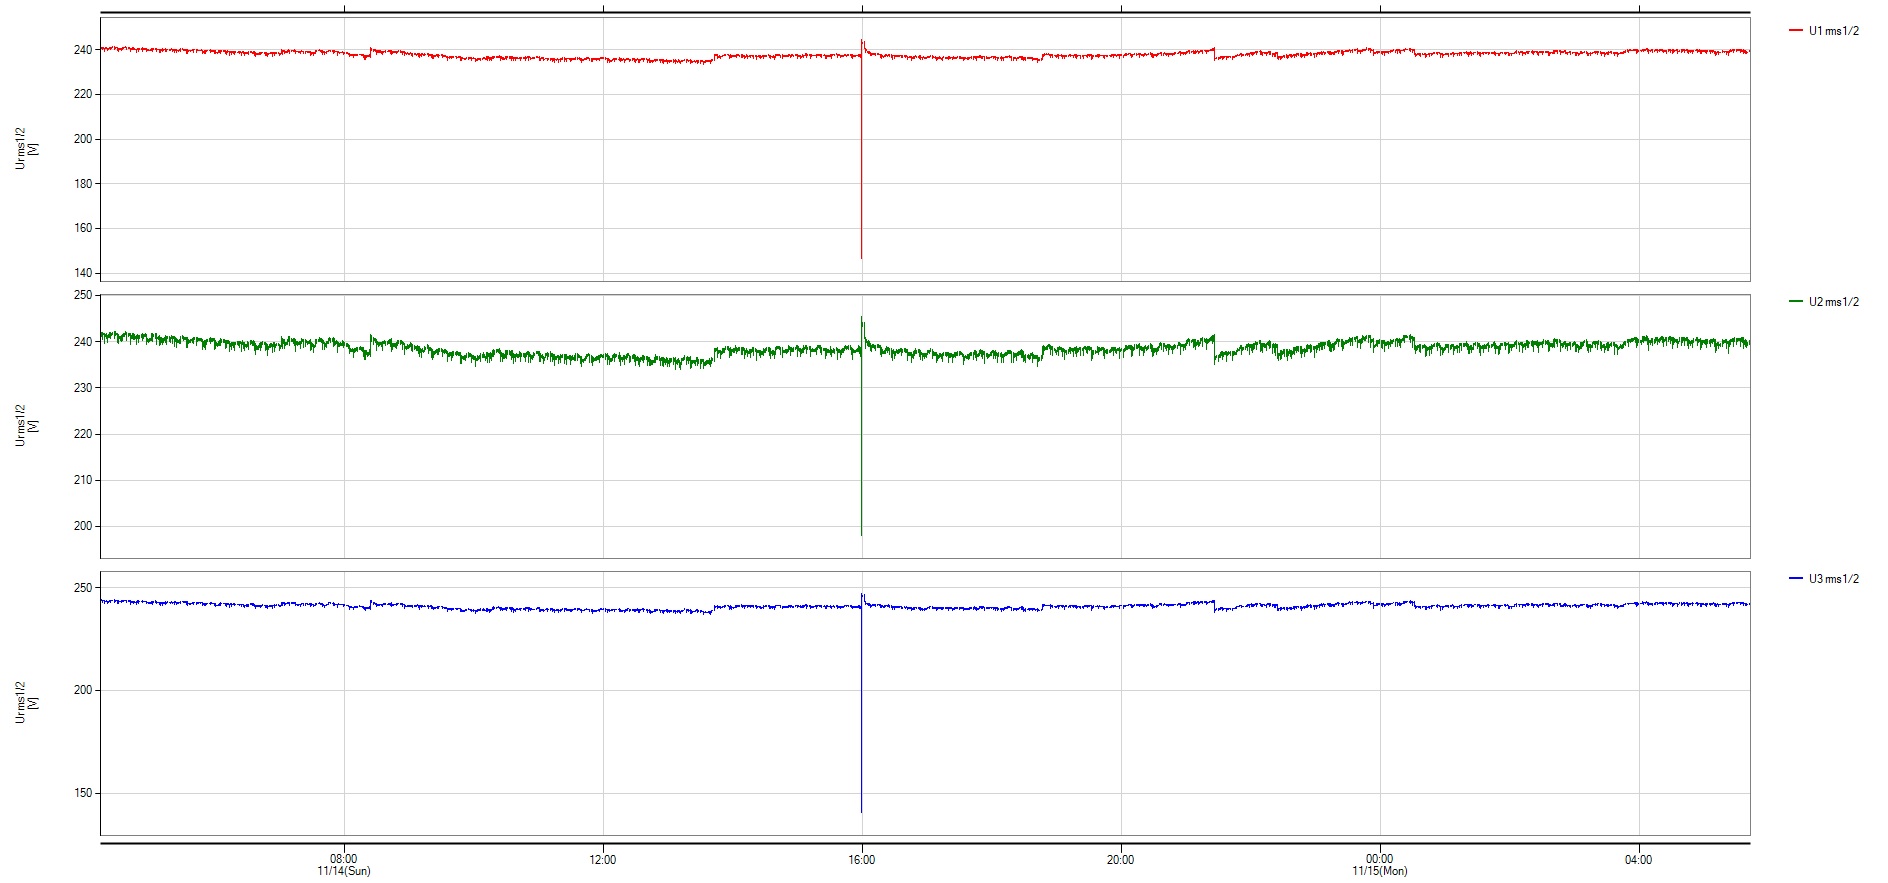
For others, you need to find things like “Detailed RMS trends”. Typically they termed this as the Vrms 1/2 trends, as seen here.
Vrms 1/2 Trend – Showing The Voltage Dip That Occurred on 14/11/2021 1600hrs (V1: 146V, V2: 198V, V3: 140V)
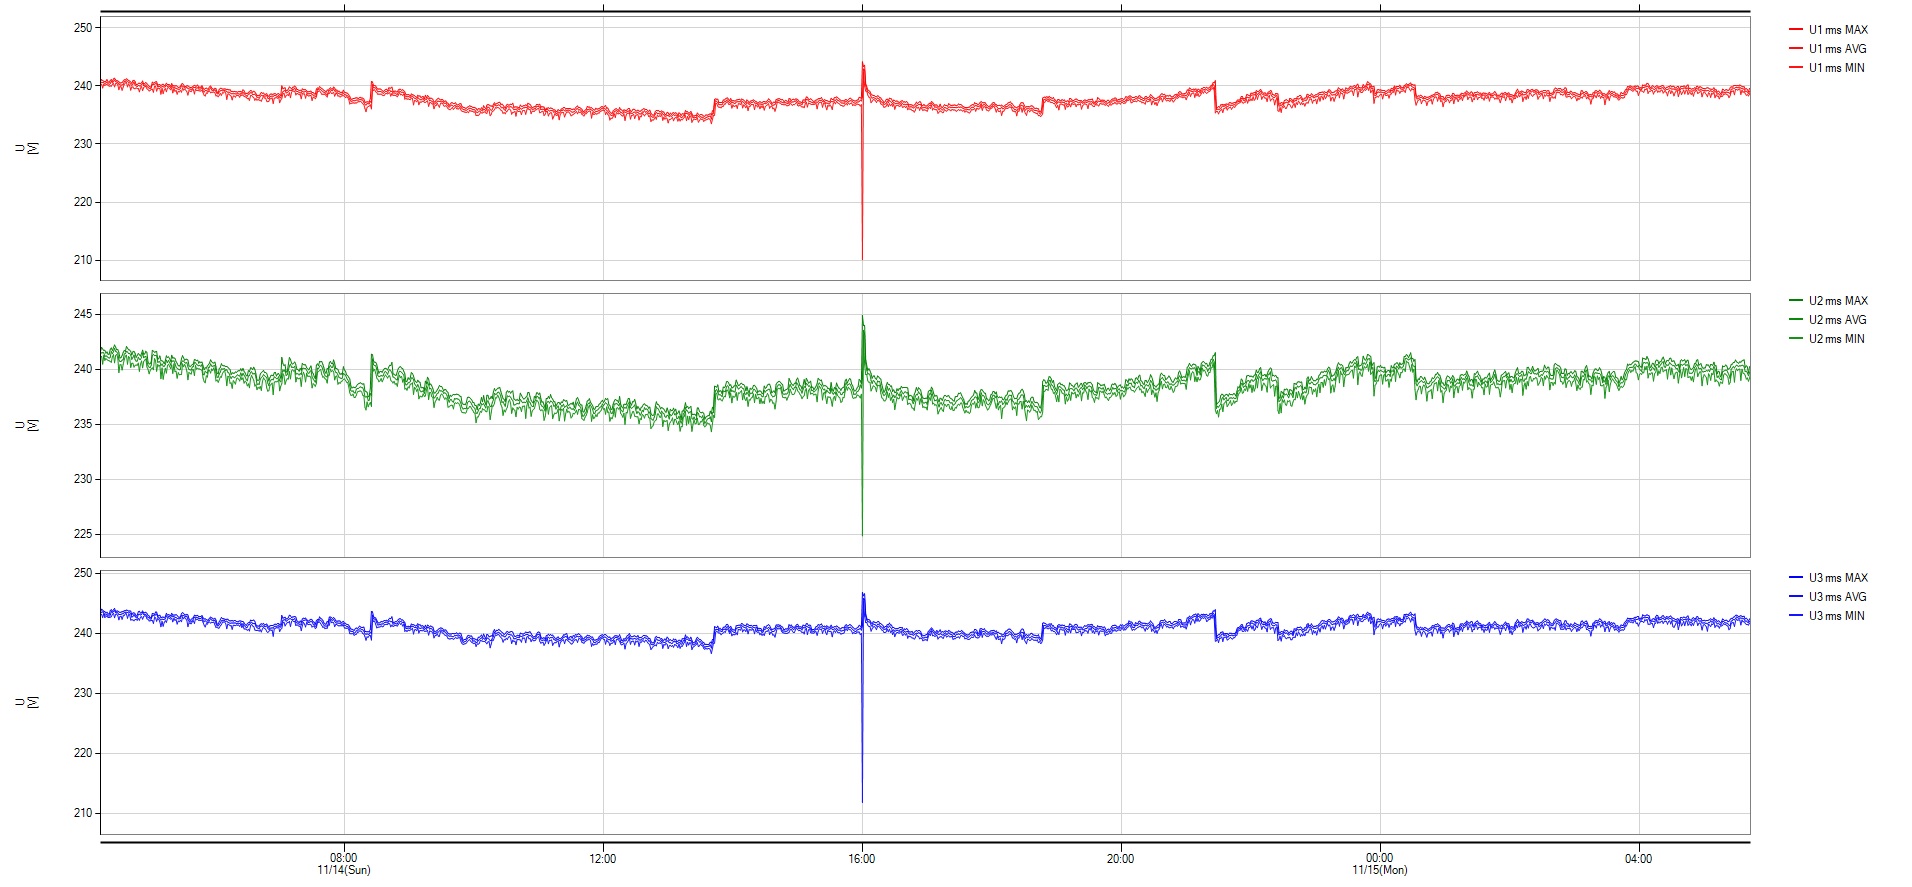
One must be careful not to plot the ‘normal’ RMS trends, which calculate out the RMS values based on sets of 10-cycle waveforms, as shown below. Values here will not show the true worst-case min/max values. Short events like a voltage dip which lasts 3-4 cycles, will get ‘diluted out’ here in a 10-cycle RMS calculation.
Vrms Trend – (V1: 210V. V2: 225V, V3: 212V) (also usually seen on standard power loggers)
What is seen on the second trend graph here is also what is usually obtained when one uses a standard power logger. Hence the difference (in capability) between a PQ analyzer and a power logger, is clearly illustrated here.
Trend Analysis
Without an event capture, it will be impossible to ascertain the actual duration of this voltage dip. However, based on the differences in the two trends (Vrms 1/2 vs Vrms) minimum values, we can tell that this dip was definitely less than 10 cycles ( < 200ms).
This monitoring was done at Low Voltage (monitored at 3P4W) in a commercial complex along Orchard Road, with V1 and V3 dropped significantly (dip by about 40%) and V2 slightly lesser (dip by about 17%). Comparing with its loading/current trend suggests this was an event upstream of the monitoring point.
Looking upstream at 22kV, dip magnitudes at 22kV will be similar (i.e 22kV dip magnitude V12 will be similar to LV V1). At 22kV, for a voltage dip of such characteristics, it was likely an event originating from a higher voltage level (you may refer to other voltage dip posts on this).
Feedback from other PQ monitors island-wide supports this. This was a transmission-level voltage dip event. The trend results suggest that it was a single-phase (L1) transmission level fault.
In Singapore, all socket outlets intended for use by ordinary persons and are intended for general use needs to have RCD protection, with rated residual operating current of not more than 30mA.
In addition, the 30mA RCDs (type AC and A) used here have faster tripping time requirements, as shown below.
It is also a common practice in both industrial and commercial work settings, that the premises’ owner requires the vendor/contractor to use portable RCD (PRCD) whenever an electrical appliance / equipment is being connected to the socket outlet.
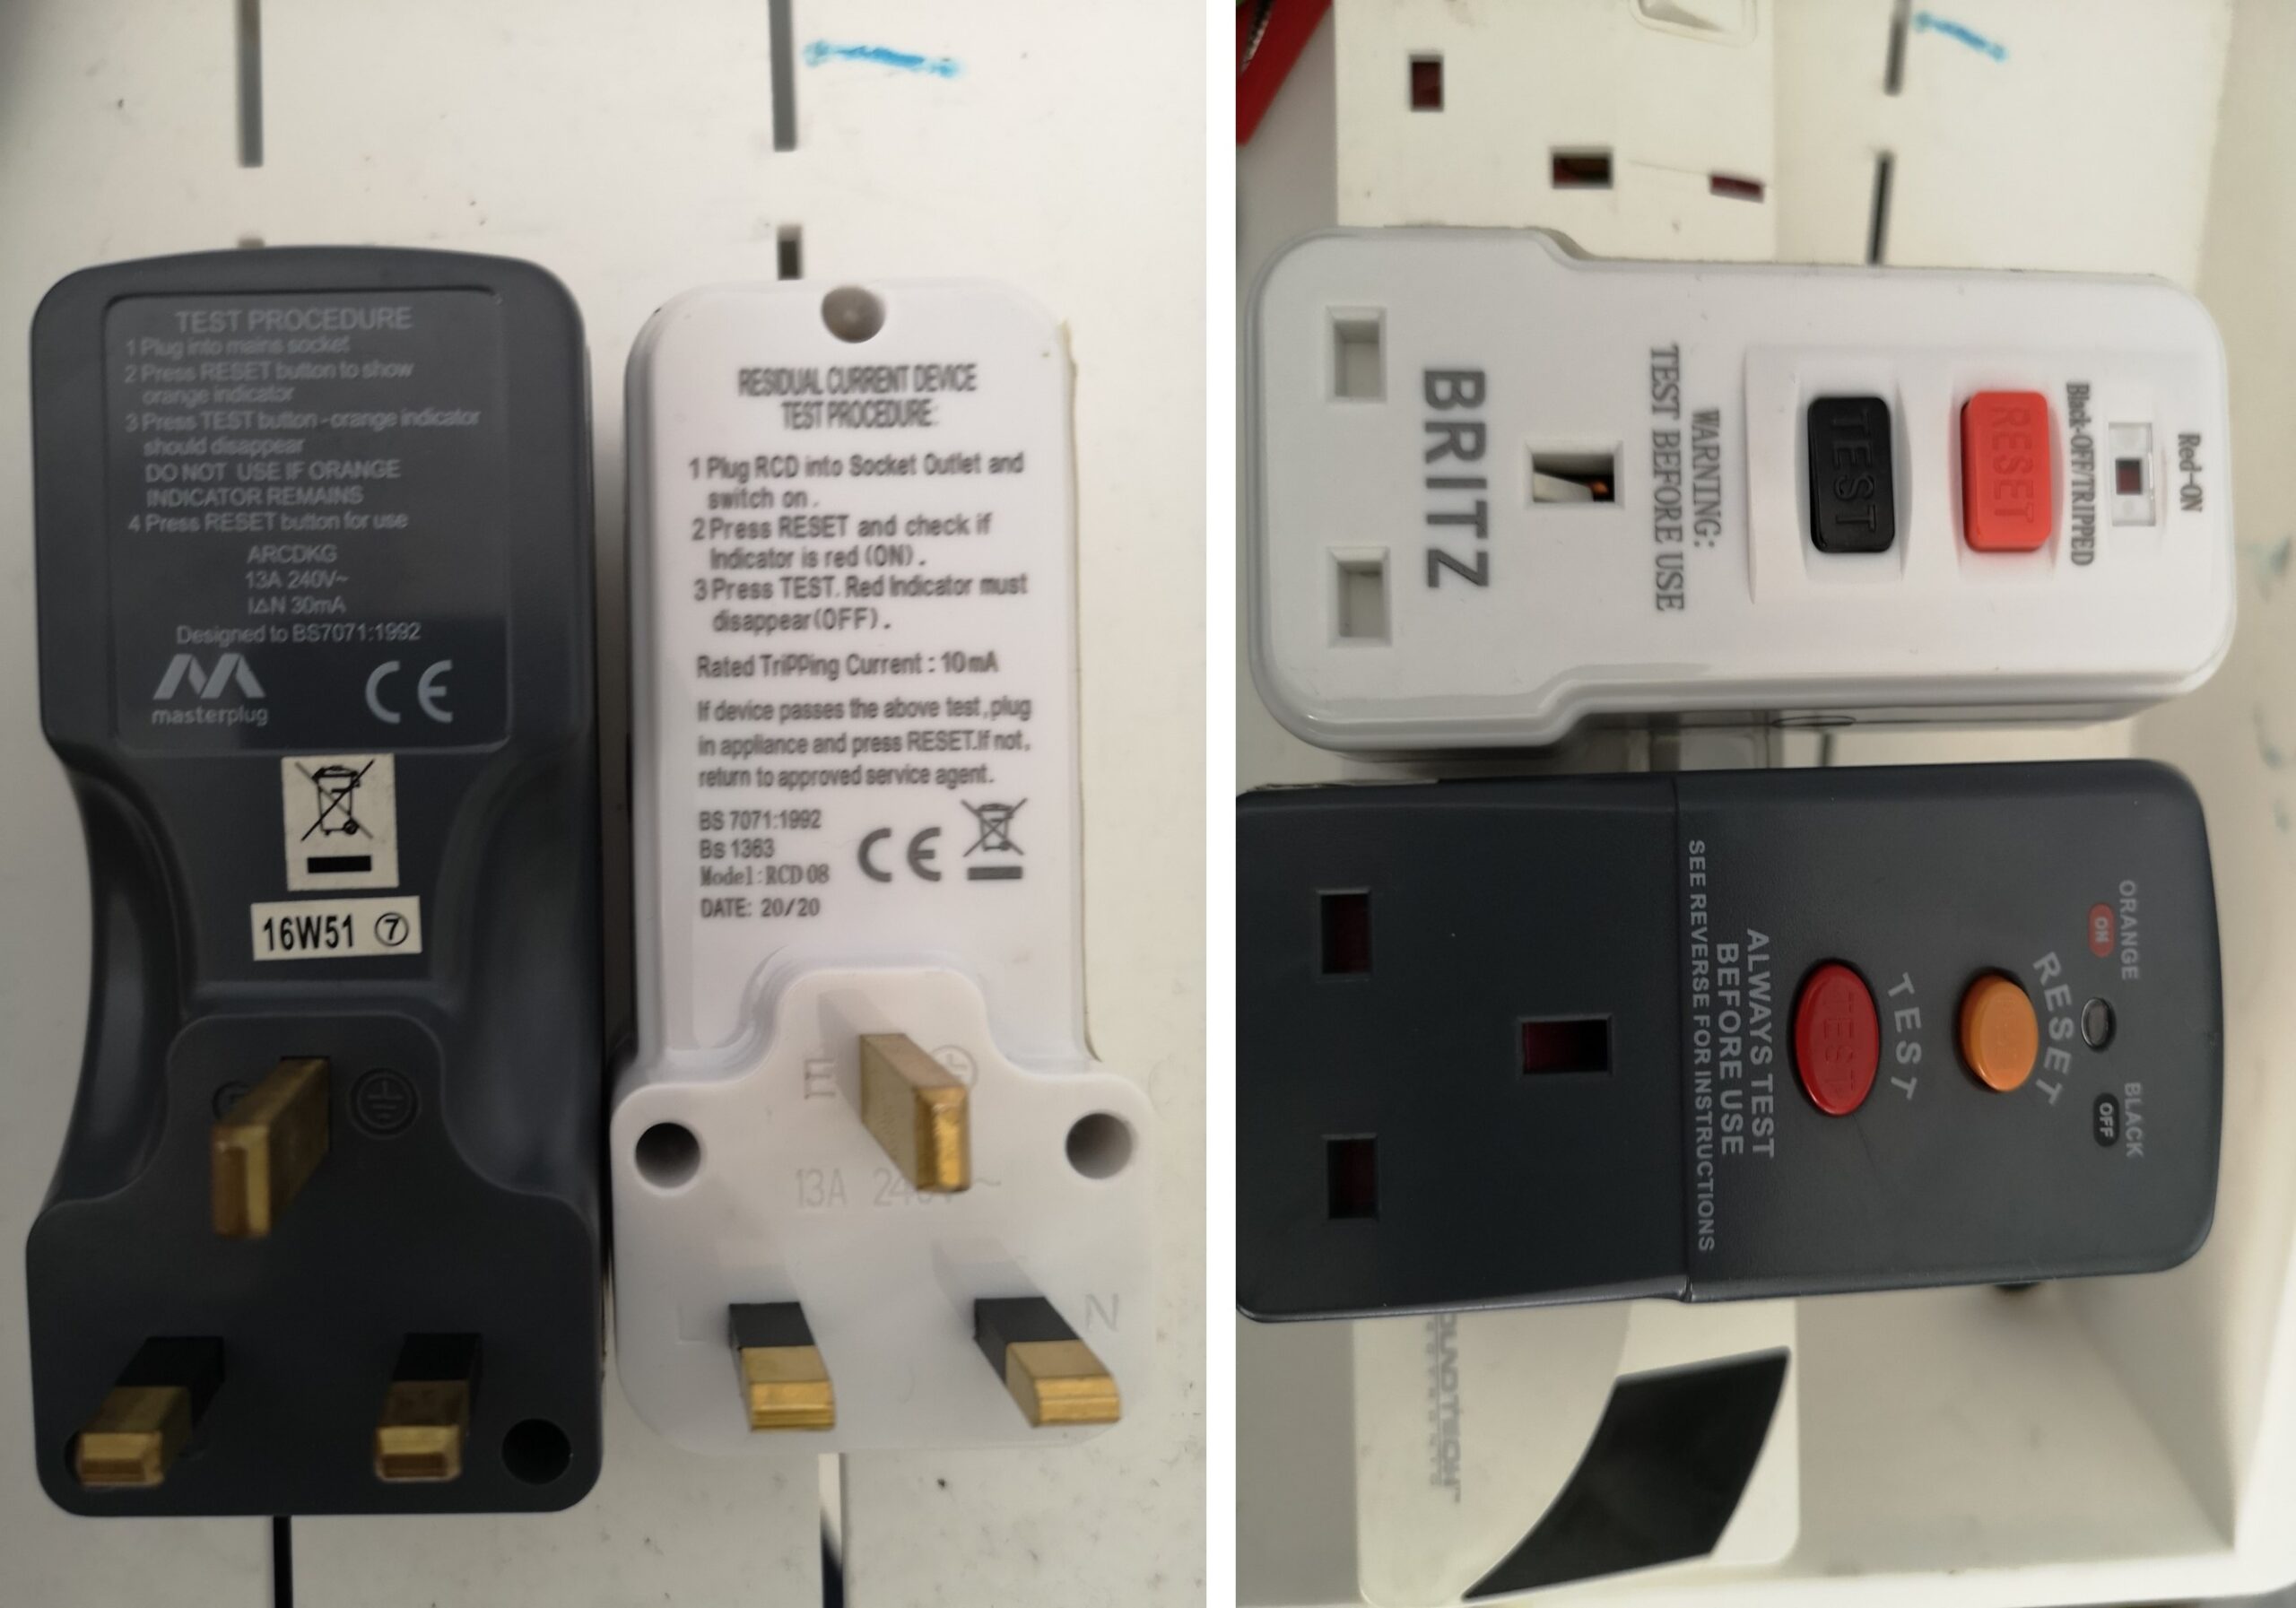
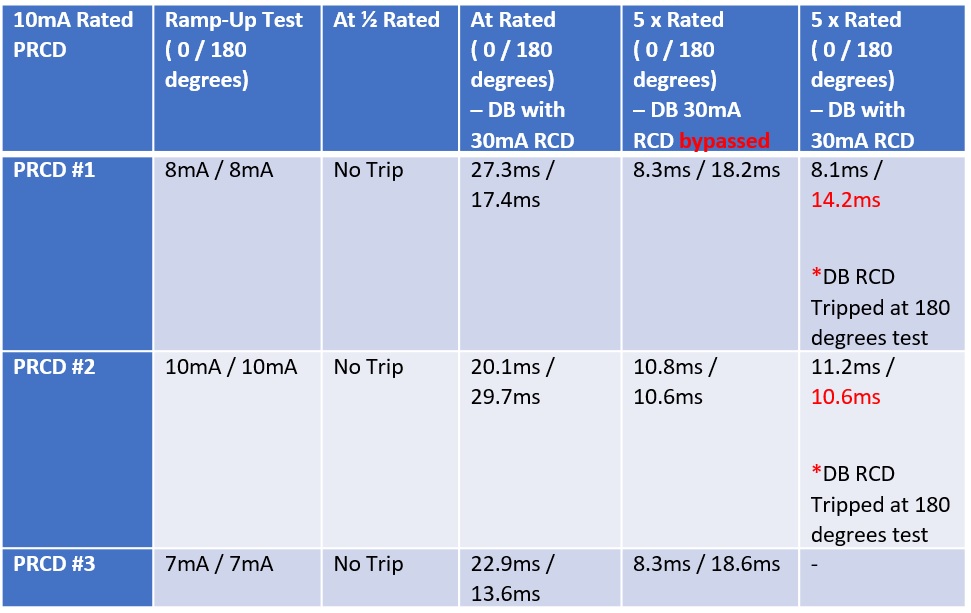
PRCD is designed to be plugged into any standard socket-outlet. An appliance / equipment can then be plugged into it. It provides additional protection against electrocution to the person in contact with the appliance/equipment (and its cable/wirings). Typical trip ratings are 10mA and 30mA.
Examples of PRCDs
It is sometimes taken for granted that this PRCD will trip first before the Distribution Board’s RCD when there is a fault at the particular appliance/equipment. While this is the ideal outcome, it is not necessarily so even if one were to use a 10mA PRCD.
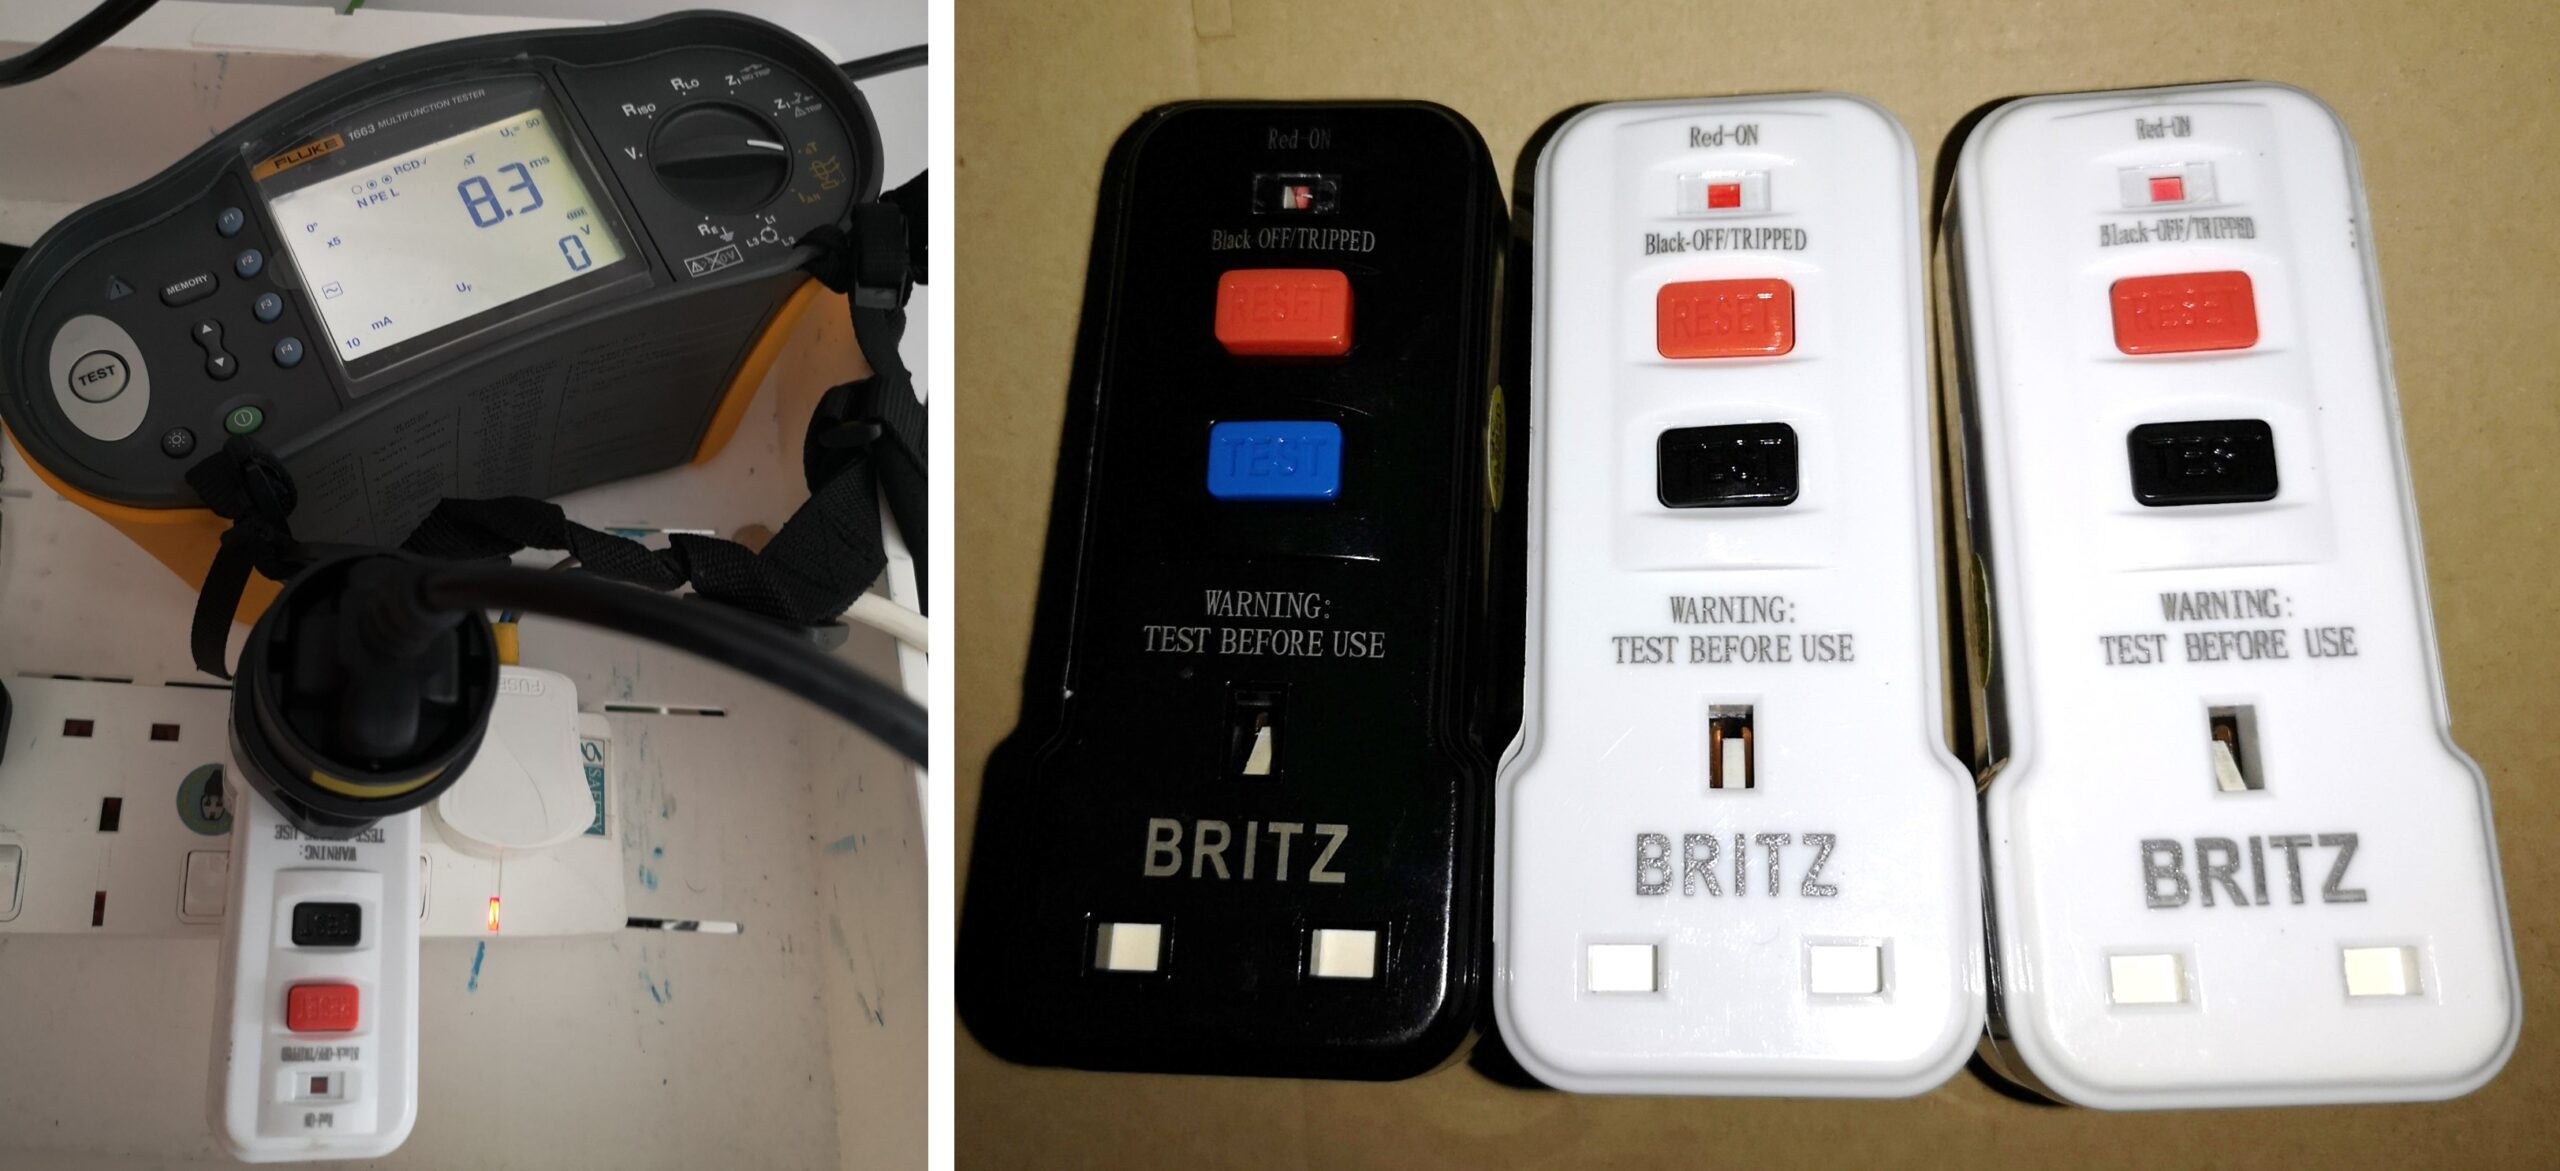
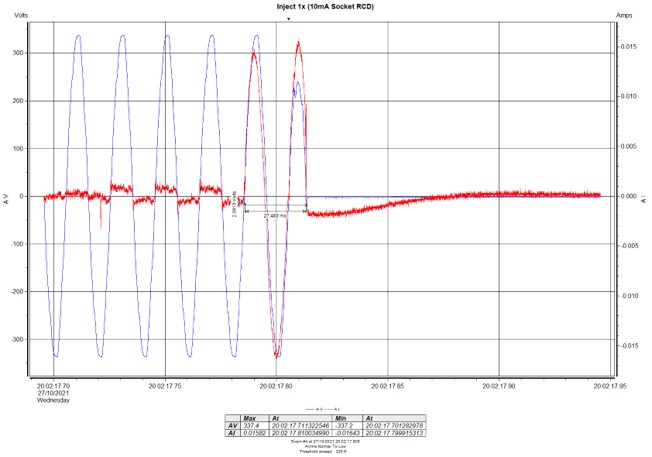
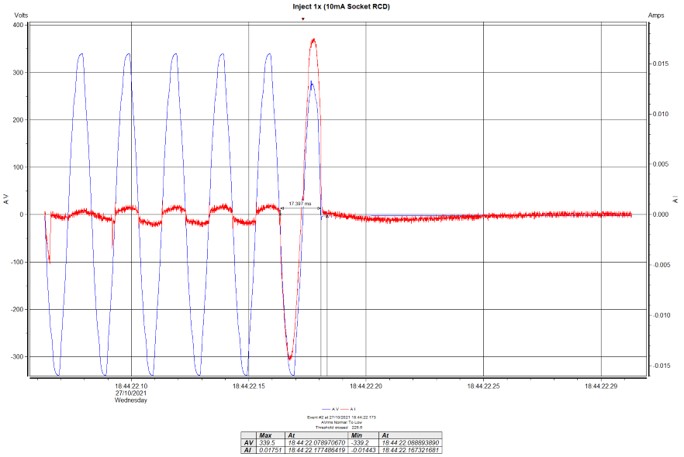
Here, three numbers of 10mA PRCDs were tested under different scenarios.
RCD Trip Tests Using Fluke 1663 Multifunction TesterNote: The Distribution Board has a background leakage current of about 6 to 7mA. Test at Rated (0 degrees)Test at Rated (180 degrees)
These simple tests have shown that it is possible for the Distribution Board’s RCD to trip due to a fault at the ‘PRCD-protected’ appliance/equipment.
It very much depends on
Background leakage current at the Distribution Board
Leakage / fault value at the appliance/equipment
Trip characteristics of the Distribution Board RCD and the PRCD