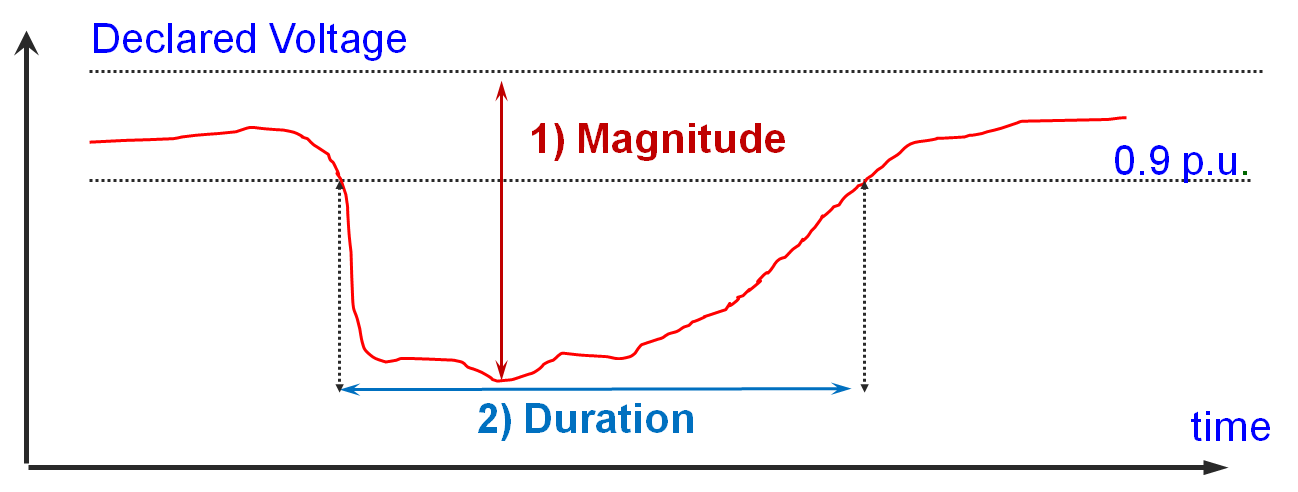
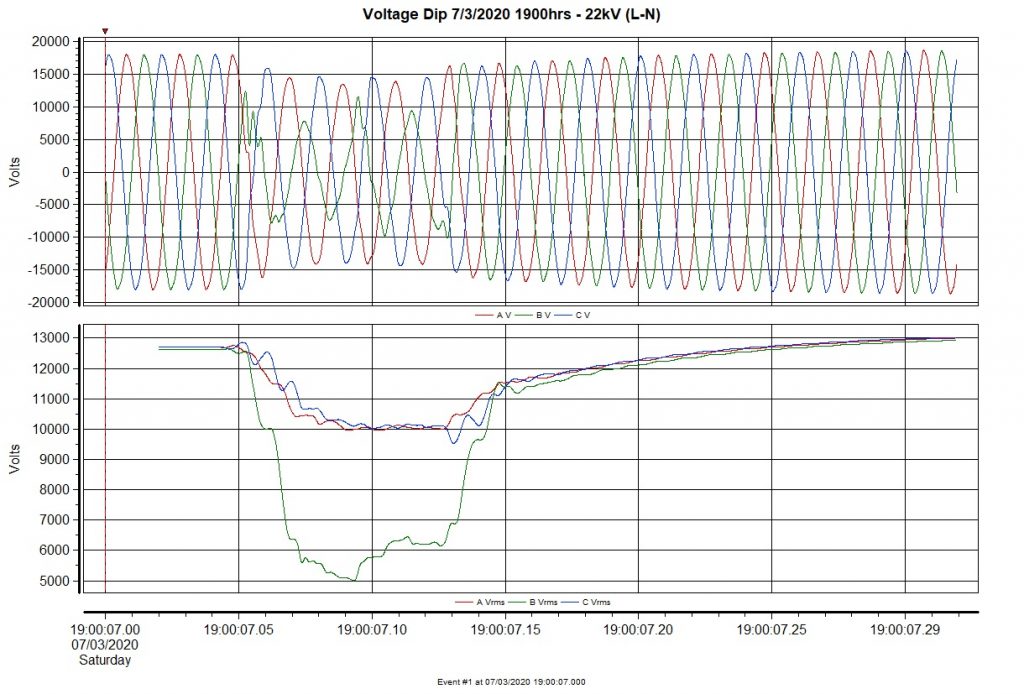
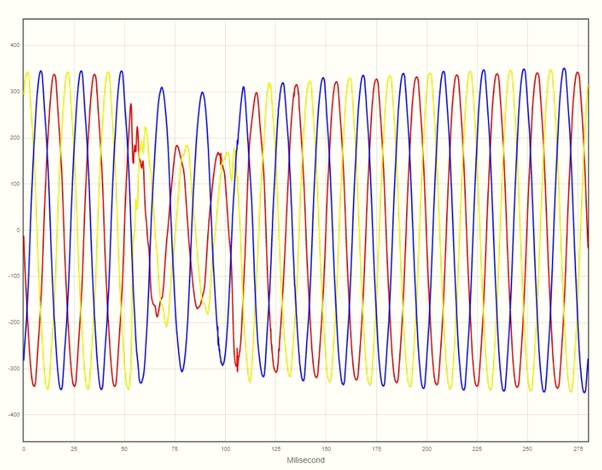
Earlier this evening, there was a Transmission-level fault that occurred at approximately 7pm. The following is a waveform captured at 22kV incomer (monitored at L-N), located in the city area.
Here, it suggests that there was a Single-phase fault (L2) and that it originated upstream at higher voltage levels. There were reports of voltage dips from other PQ monitors in other transmission blocks as well.
Update: Suspected fault originated from Genco facilities in the west.
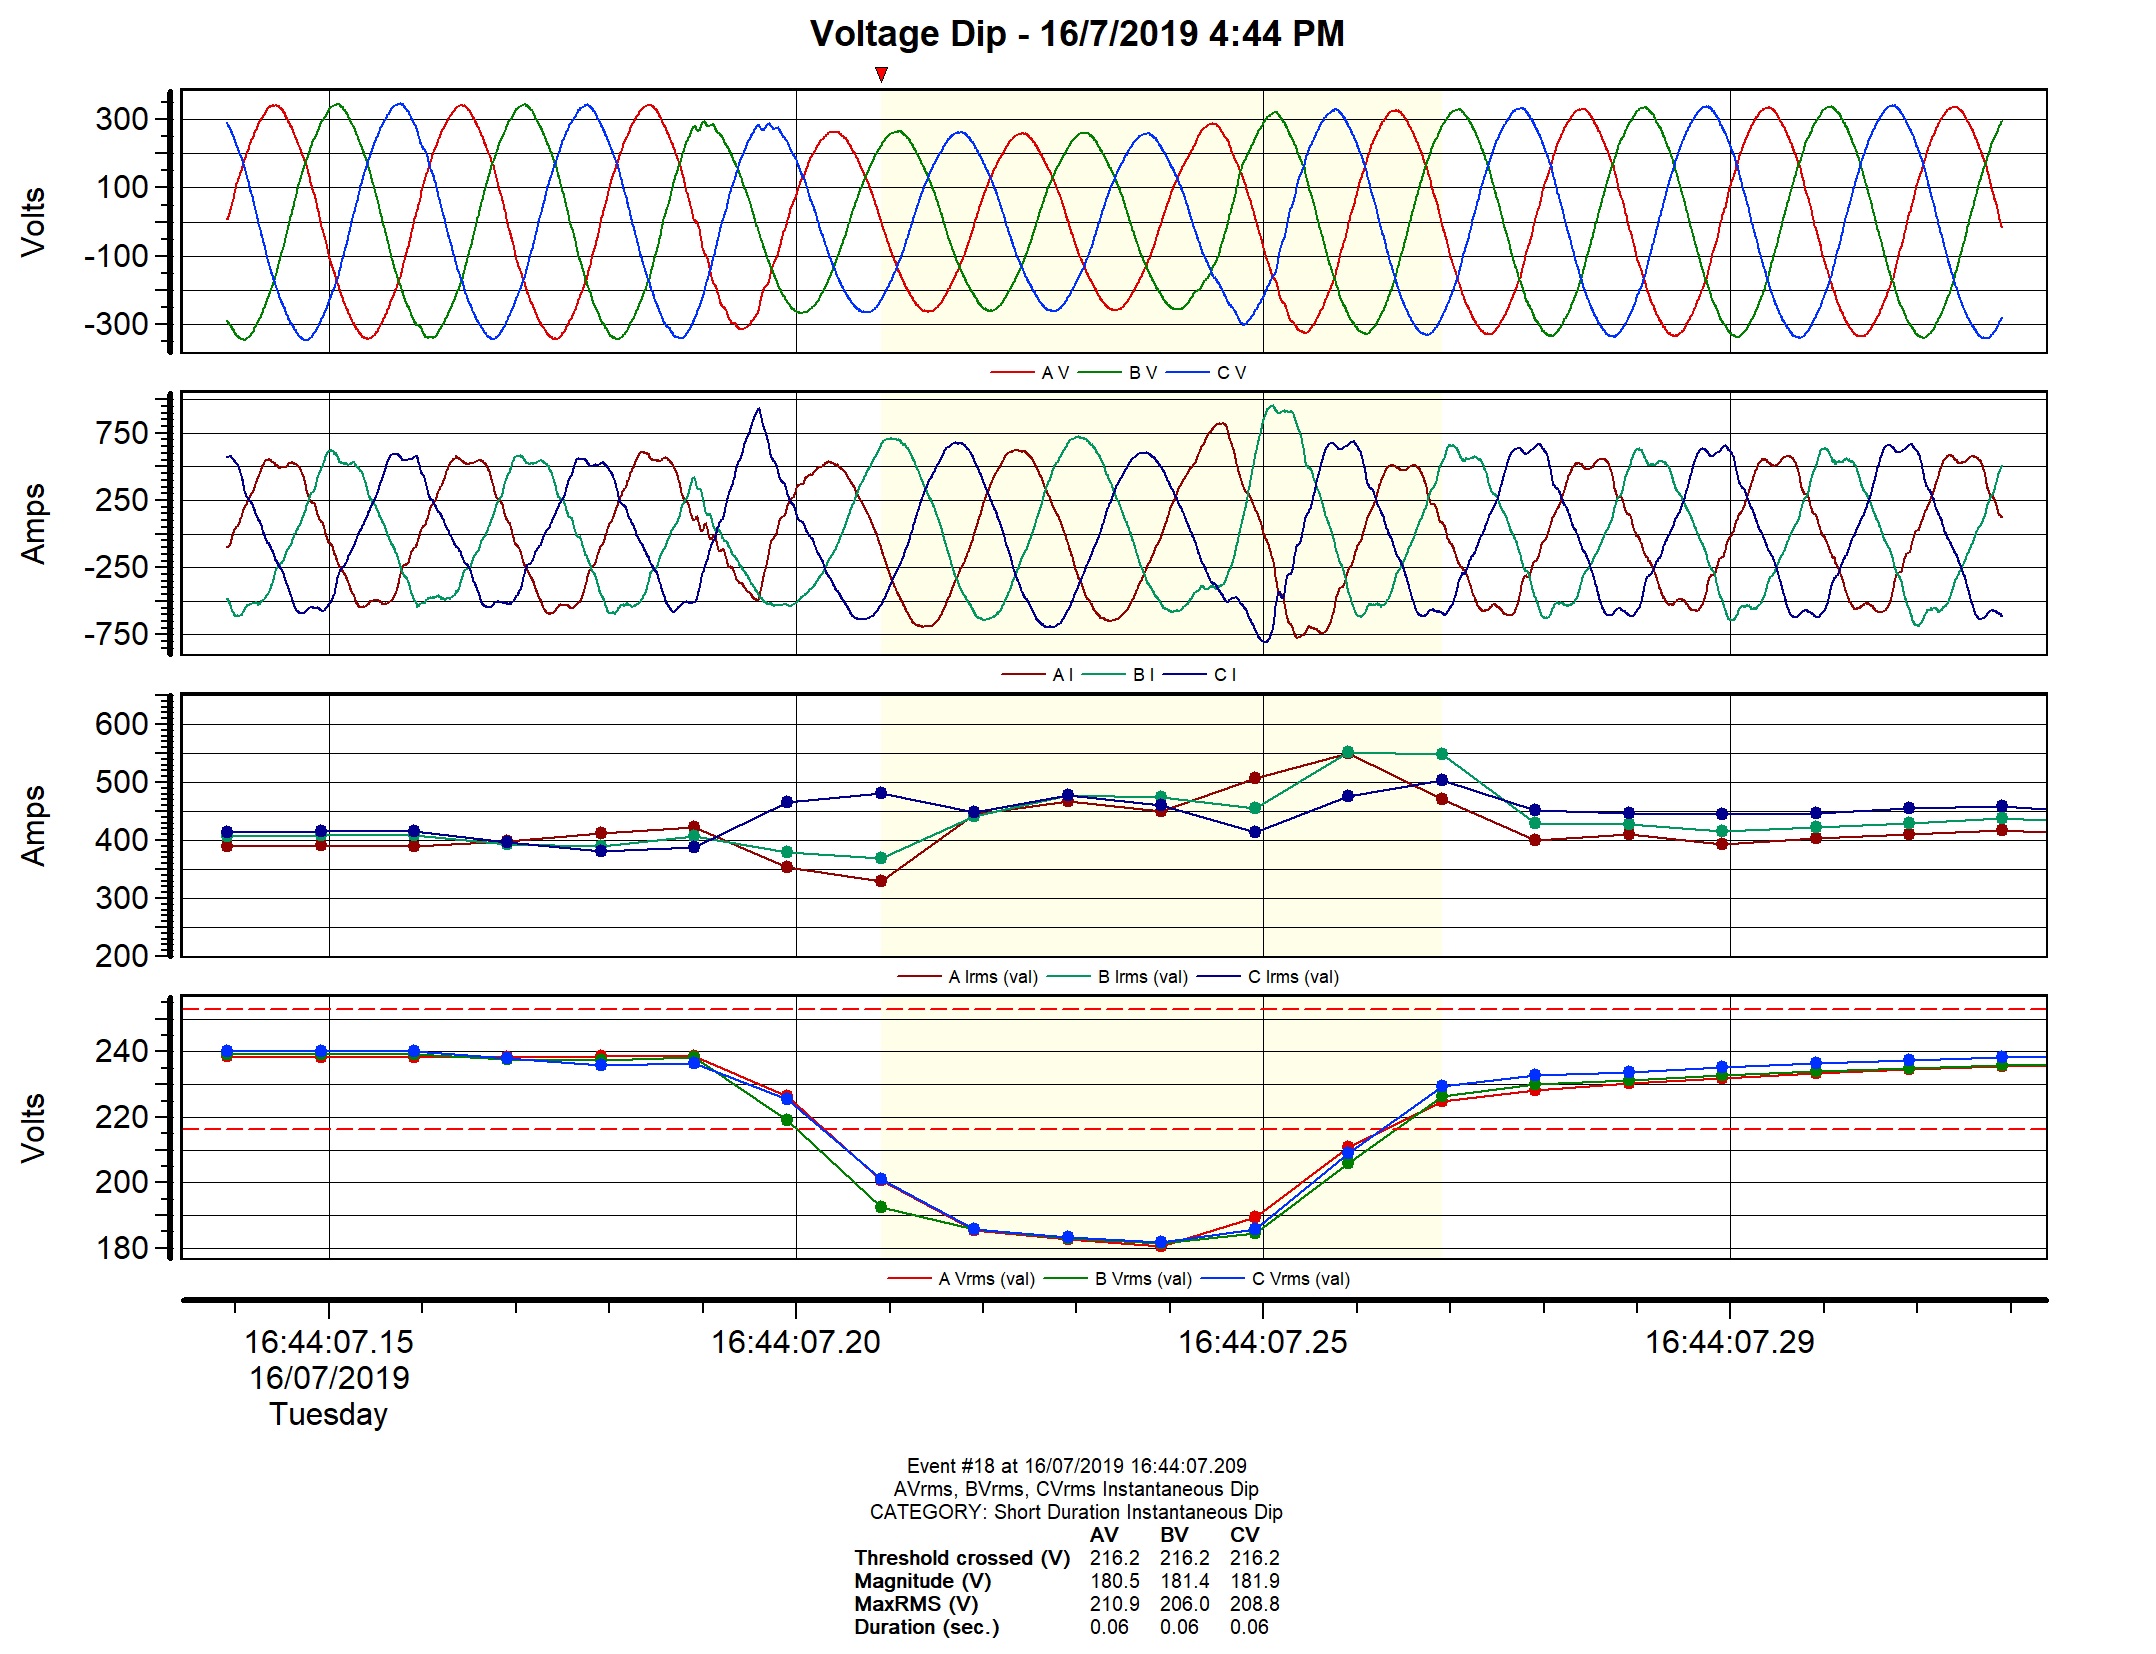
Earlier this morning, there was a Transmission-level fault that occurred at approximately 10:07AM. PQ monitors in the city-area captured the following waveforms at the 22kV incomer and at the 400V LT incomer side.
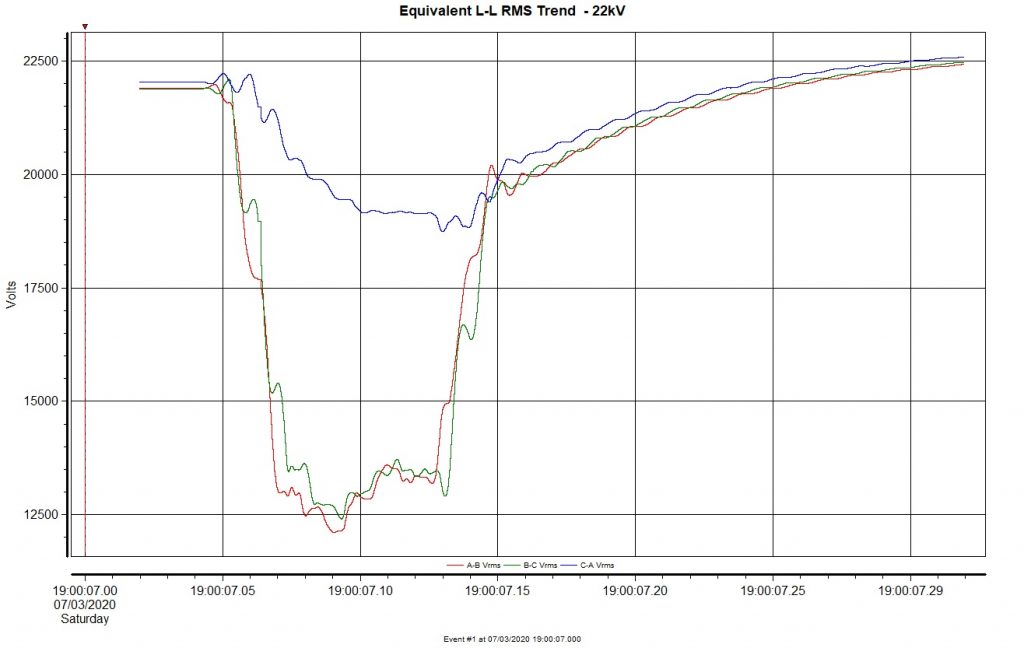
Here, the benefit of monitoring at L-N instead of L-L at 22kV is being showed clearly here. It is evident that there was a single-phase fault (L2) and that it originated upstream at higher voltage levels.
Note. A single-phase fault at 22kV will cause the other two phases to swell (not seen here).
There were reports of voltage dips in other transmission blocks from other PQ monitors. With this kind of magnitude observed here at 22kV, it is very likely that this fault originated in the same transmission block as well.
Update: 230kV cable damage along Keppel Road (South Region).
22kV Incomer – Monitored at L-N (South region)
LT Incomer – Monitored at L-N (South region)
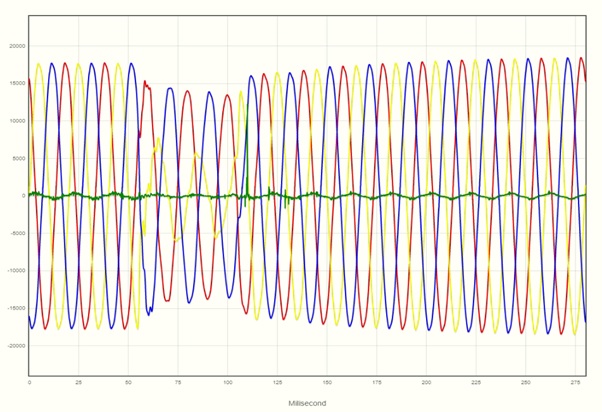
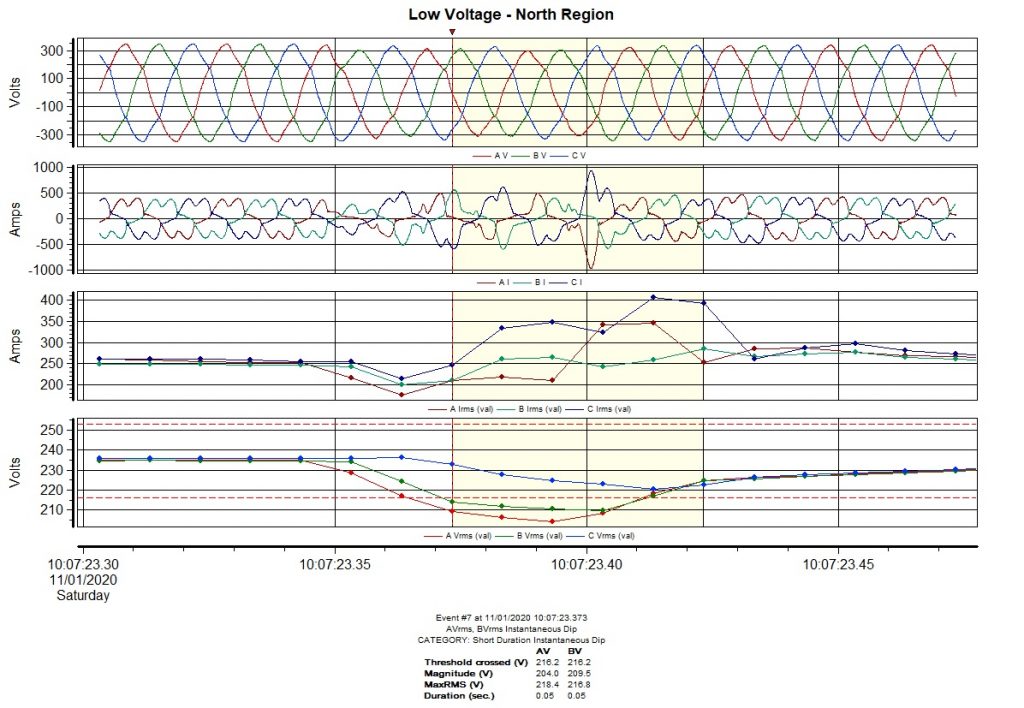
When a 230kV fault occurs, a quarter of Singapore will feel the worst dip magnitude (the region where the fault occurs), with the other 3 regions observing shallow voltage dips. Below is an example (via a Dranetz HDPQ) in the North region of Singapore during this same incident.
Earlier in the week, areas in Tampines, Loyang, Bedok, Pasir Ris will have experienced voltage dips. It was made known later that it was due to a 22kV cable fault in Tampines area.
Few sets of our portable PQ analyzers placed in Loyang was able to capture this event. It registered voltage dips (at low voltage) of about 20%, lasting around 60-80ms. Recorded data showed that it was a three-phase fault.
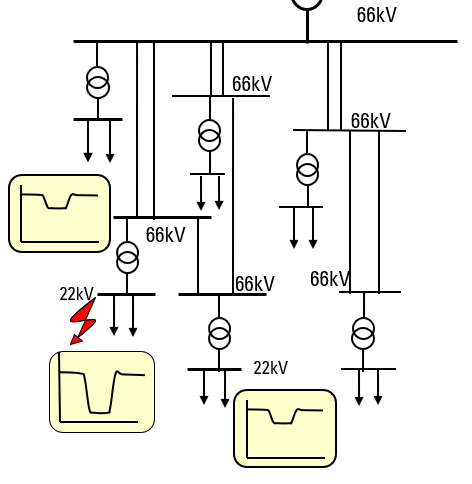
One may be curious, how could a fault in Tampines result in a voltage dip in places like in Loyang or Bedok?
Our local distribution grid is densely interconnected, resulting in a high-reliability electricity network. Total blackouts are rare. But interconnectivity brings about a small disadvantage. Any fault will be seen/felt (in the form of a voltage dip) by everyone who is connected. The seriousness of this dip will be dependent on the types of faults and the electrical distance between you and the fault point.
Here in our case, the fault was in Tampines area. Based on experience, for a voltage dip ~ 20% to be seen at another 22kV network, it will need to be a significant fault causing a voltage dip in the range of 80-90% in the fault area (Tampines). Loyang (where our PQ analyzers were) is connected to Tampines at 66kV level.
Came across an interesting case recently, whereby the engineers taking care of a particular shopping mall had failed to obtain an earth loop impedance value on just one of the phases. Issue came to light as the electrical inspectors failed to obtain a complete earth loop results for the new tenants that are setting up shop in the mall.
Was called in to investigate if power quality is a factor here.
Background
– Similar “incomplete” earth loop values were obtained at the LV Main Switchboard. “OL” when measured between Phase L1 and Earth. Had used different sets of earth loop testers.
– Thorough checks were conducted on the distribution transformer, earth cables and the neutral-ground connection at the transformer.
– Loads on this particular switchboard include the building’s chiller systems and some tenants’ loads.
– Was reported normal earth loop values could be obtained when the chiller system is not in operation.
Recall:Earth Loop Impedance Test
– One of the tests conducted for an Electrical Installation “Pass” Certificate.
– To ensure when a fault occurs in an electrical installation, sufficient current will flow to operate the fuse or circuit breaker protecting the faulty circuit within a pre-determined time.
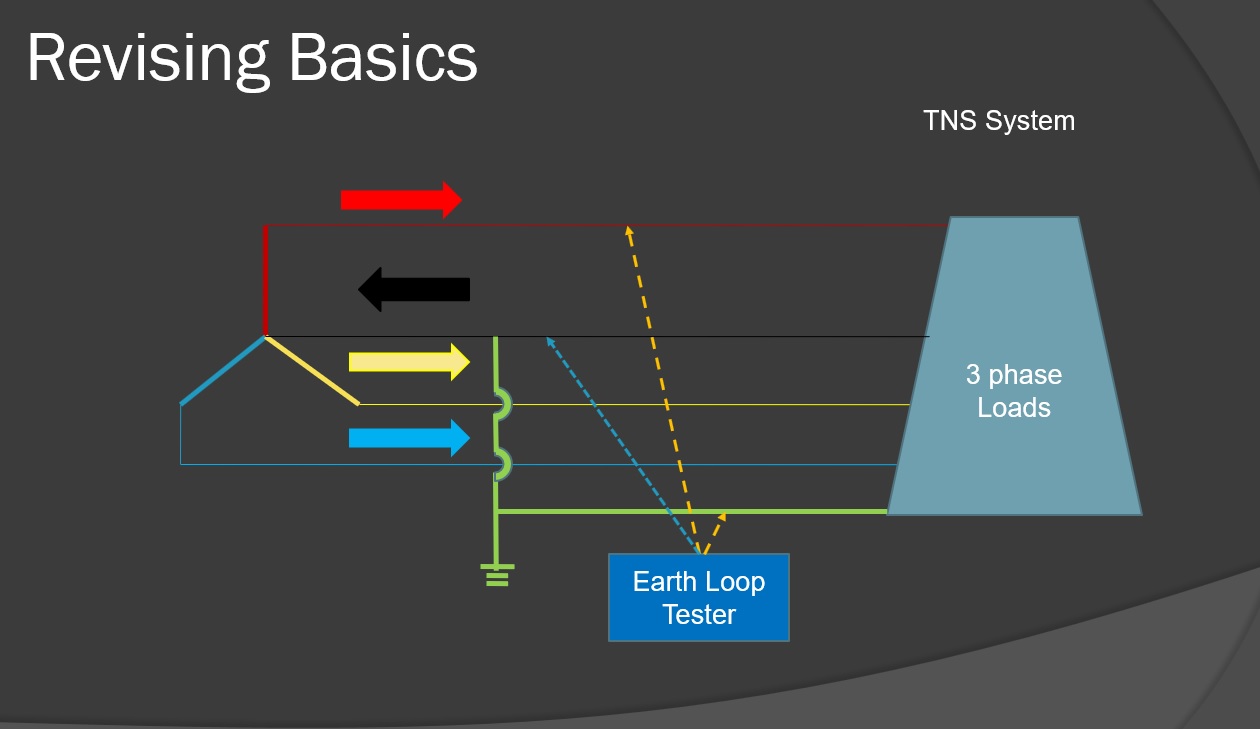
Recall: Earth Loop Tester
– Operates by inducing a current from the Supply system, by introducing a calibrated load between the phase conductor and the protective earth.
– And then monitors the voltage difference.
– Comes in various forms (Multifunction tester vs. Dedicated tester); (3-wire types L+N+E vs 2-wire types L+E)
Earth Loop in a TNS
Findings
– Conducted separate earth loop tests at LV Main Switchboard and monitored the quality of supply.
earth loop tester and pq monitor
– Apart from one failed attempt via the multifunction tester, subsequent tests produced repeatable earth loop impedance values across all the 3 phases.
– “OL” when measured between Phase L1 and Earth, used “K-brand” earth loop tester(s).
– VTHD on “high side” but expected due to the a few nos of variable speed drives being used at the Chiller system.
– Phase L1 – noticed multiple zero crossings.
Conclusion
– The quality of the supply waveform on Phase L1 affected / influenced the operability of the other earth loop testers, resulting in giving “OL” readings. An interesting case!
– Newer earth loop testers do have a ‘harmonic component’ – to cater for (IEC 61557-3:2007).
Much has been said about the blackout on Tuesday morning. Thus far, these are the official findings
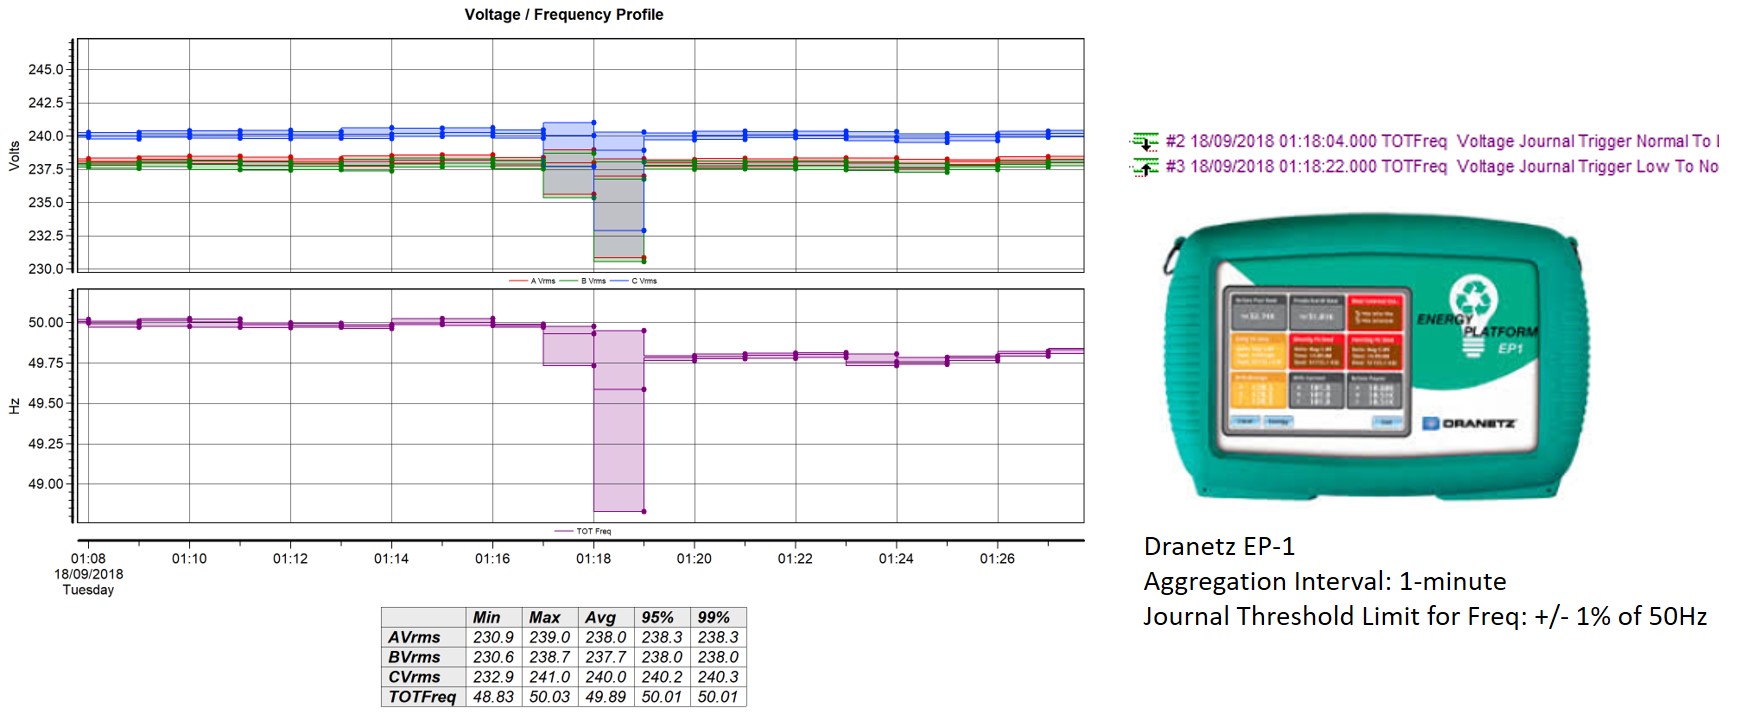
Disruption lasted for about 38 minutes, between 1:18AM and 01:56AM on the 18 September 2018.
19 areas in Singapore were affected: Boon Lay, Choa Chu Kang, Clementi, Jurong, Pandan Loop, Aljunied, Geylang, Tanjong Rhu, Mountbatten, Kembangan, Bedok, East Coast, Ang Mo Kio, Bishan, Thomson, Mandai, Admiralty, Sembawang and Woodlands (~146,000 customers).
Caused by the tripping of power generation units belonging to Sembcorp Cogen and Senoko Energy.
Dubbed the worst major power outage since 2004.
Previous major blackout (albeit much smaller scale than this incident) was on 1 June this year confined to the CBD area.
We had one advanced energy logger on-site (an office in Cecil Street – CBD area), doing harmonics compliance measurement during the incident. Here, the trending graphs showed that frequency ‘dipped’ down to as low as 48.83 Hz. The journal logs showed that it returned to its normal operating range (49.5 Hz to 50.5Hz) in about 18 seconds (Nation-wide under frequency relays automatically kicked in for load shedding during these 18s).
Unfortunately, we did not use our higher-end equipment here (Dranetz HDPQ for instance). Hence the limited information (eg. Waveforms, detailed rms trends, etc could not be shown).
This particular office was not affected by the blackout.
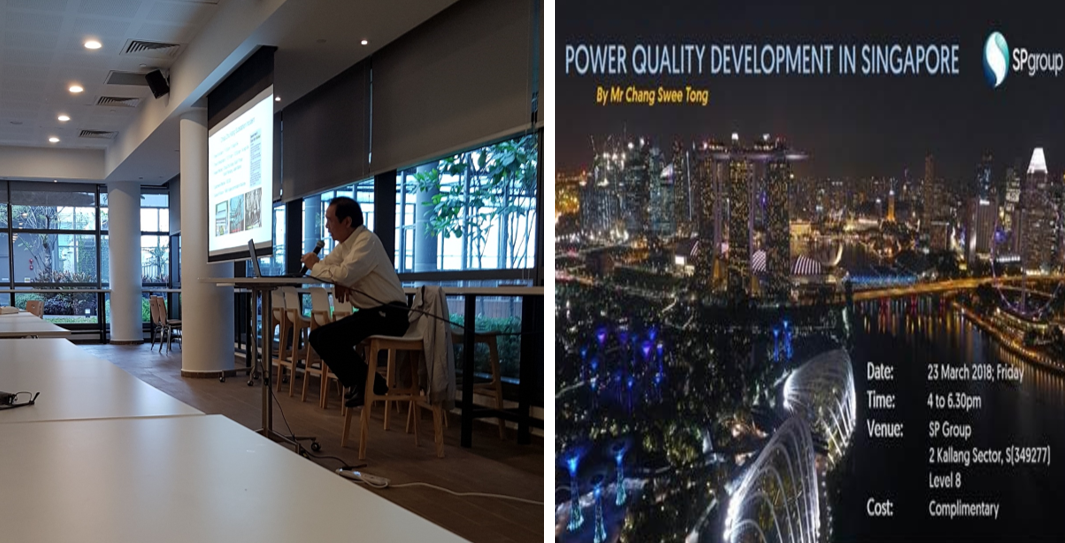
I was invited to a talk by my former Deputy Managing Director, Mr. Chang Swee Tong at SP Group HQ.
It was a like a walk down memory lane, as he went thru various PQ-related initiatives that he led while at the helm.
Got to meet some old friends and mentors too.
Thanks again to SP Alumni Secretariat for the invitation.
.
A paper on the same topic by Mr. Chang and the seniors of my old section can be found here.
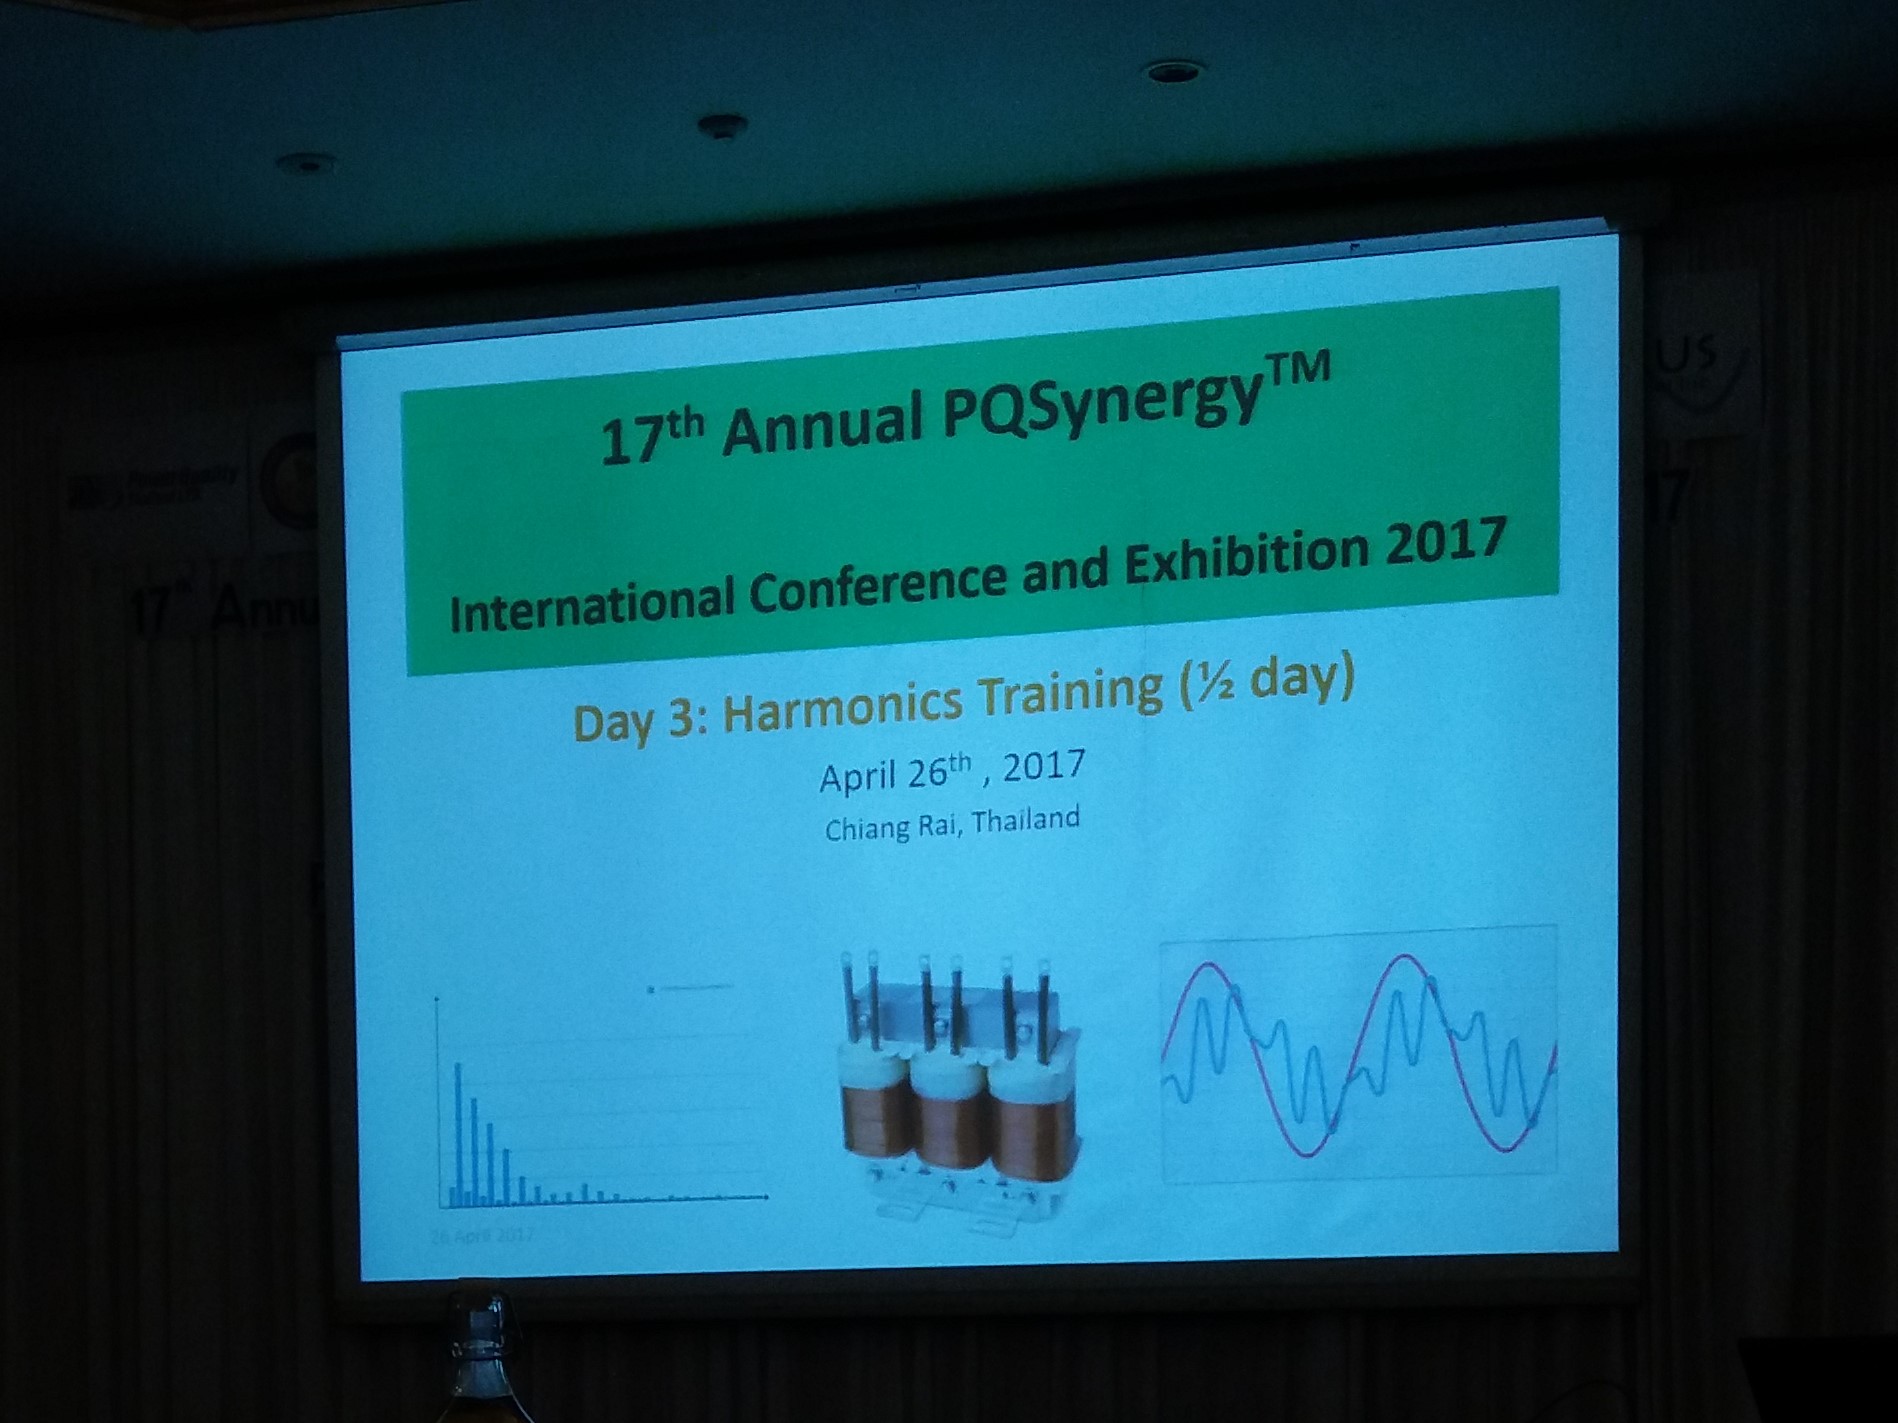
The third and final day of PQSynergy 2017 ends with a sharing session by PQT’s Terry Chandler and Mirus’ Tony Hoevenaars on the topic of harmonics.
It has been another fruitful conference, with a good mix of local and international speakers. Thomas Pua’s (PSL) presentation on synchrophasors was particularly interesting and Bill Howe’s (EPRI) insights on the proactive use of PQ data is a welcome change for the industry.
I always look forward to these sharing sessions with fellow practitioners, something not common back home for me, especially in power quality.
This year, I shared some common and simple day-to-day PQ related cases encountered back in Singapore. The presented slides will soon be available for download at www.pqsynergy.com
A technical report regarding voltage fluctuations was recently published by Cigre. The working WG C4.111 was set up to look into the possible changes to existing voltage fluctuation compatibility levels. This is mainly due to the widespread opinion (myself included) that modern lighting are less susceptible to voltage fluctuations as compared to the traditional 60W incandescent light bulb which formed the basis for the Pst (Short Term Flicker) concept.
In summary, it was found that it was not definitive (at this time) to confirm this widespread opinion. While many of the modern lamp technologies tested were less sensitive, there were some that were tested to be more sensitive. It is thus concluded that the existing limits or compatibility levels for voltage fluctuation remain for the time being.
The full technical report (Review of LV and MV compatibility levels for voltage fluctuations) can be found at www.e-cigre.org
My 2nd year presenting a topic in PQSynergy. It has been an enjoyable 2-day conference.
Made new friends and learnt new things from fellow practitioners. Glad to have met the guys from Sonel too.
Will definitely take a closer look at some of your instruments.
And congratulations to Terry Chandler and his Power Quality Thailand on another successful conference.
Happy 30th anniversary, PQT. Many more good years ahead.