Frequency Changes During A Voltage Dip

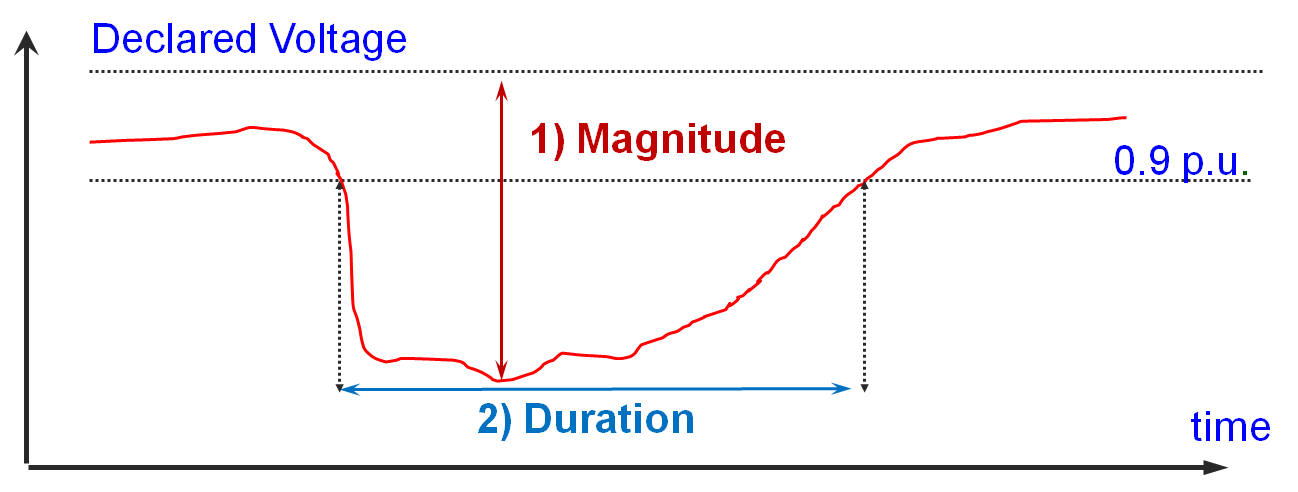
“Does frequency changes during a voltage dip?” – A favourite question among many. The answer is “Yes”.

This will be quickly followed by “But why our power quality monitor did not show significant changes in the frequency values even though a voltage dip event was captured?” The general answer is that the standard (IEC 61000-4-30) does not require it to measure such detailed changes in frequency values.

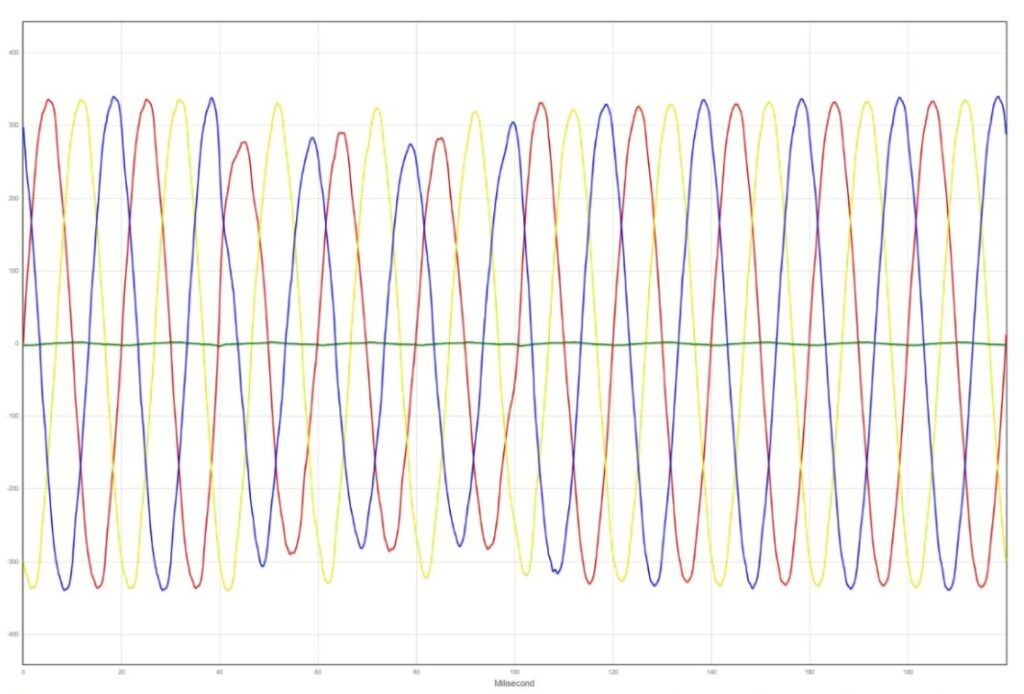
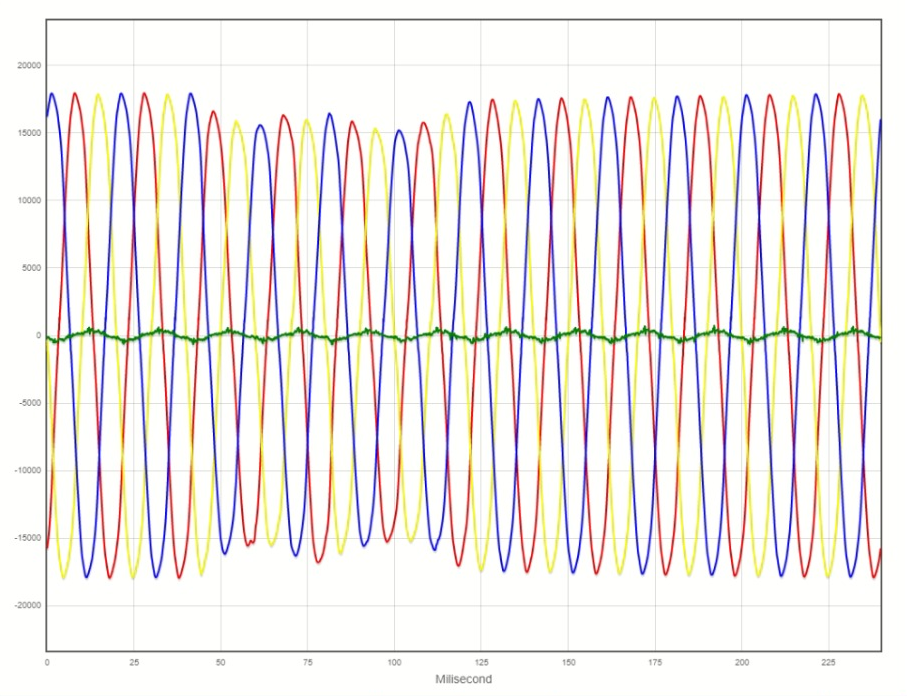
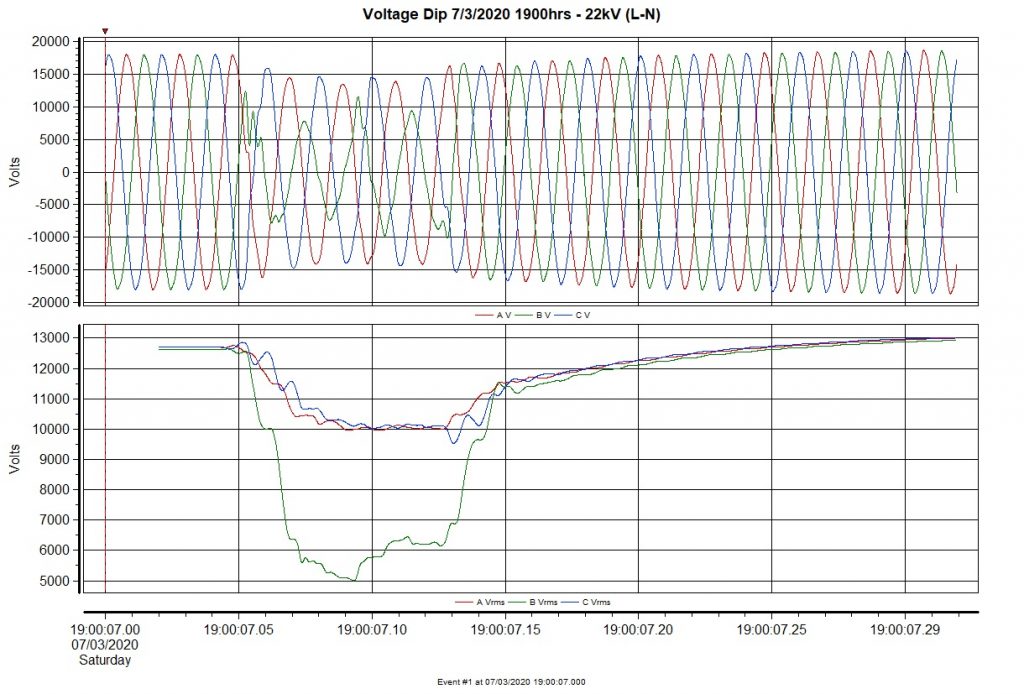
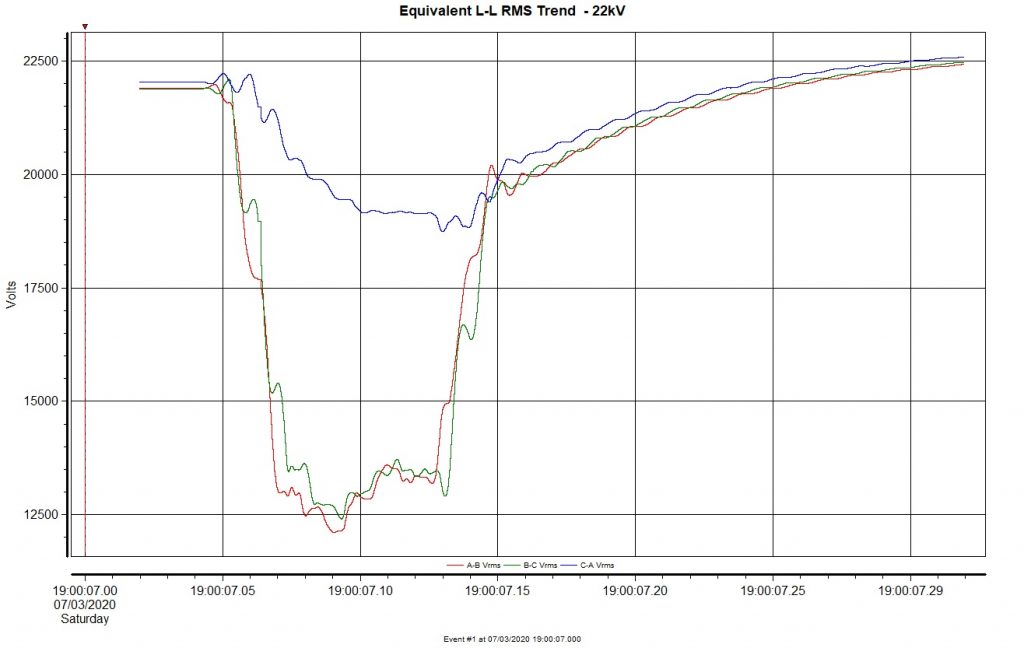
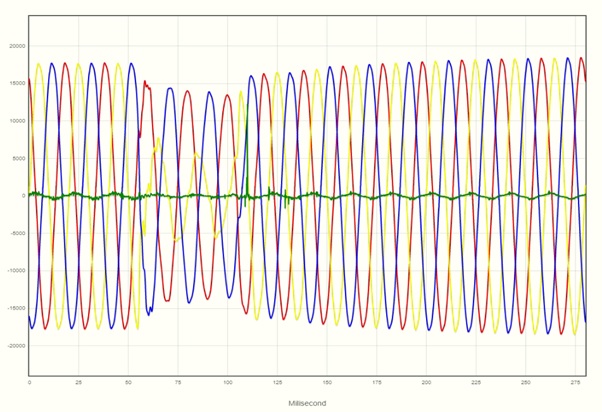
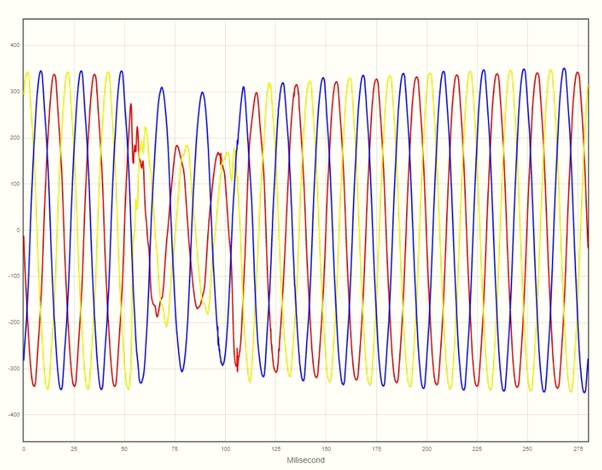
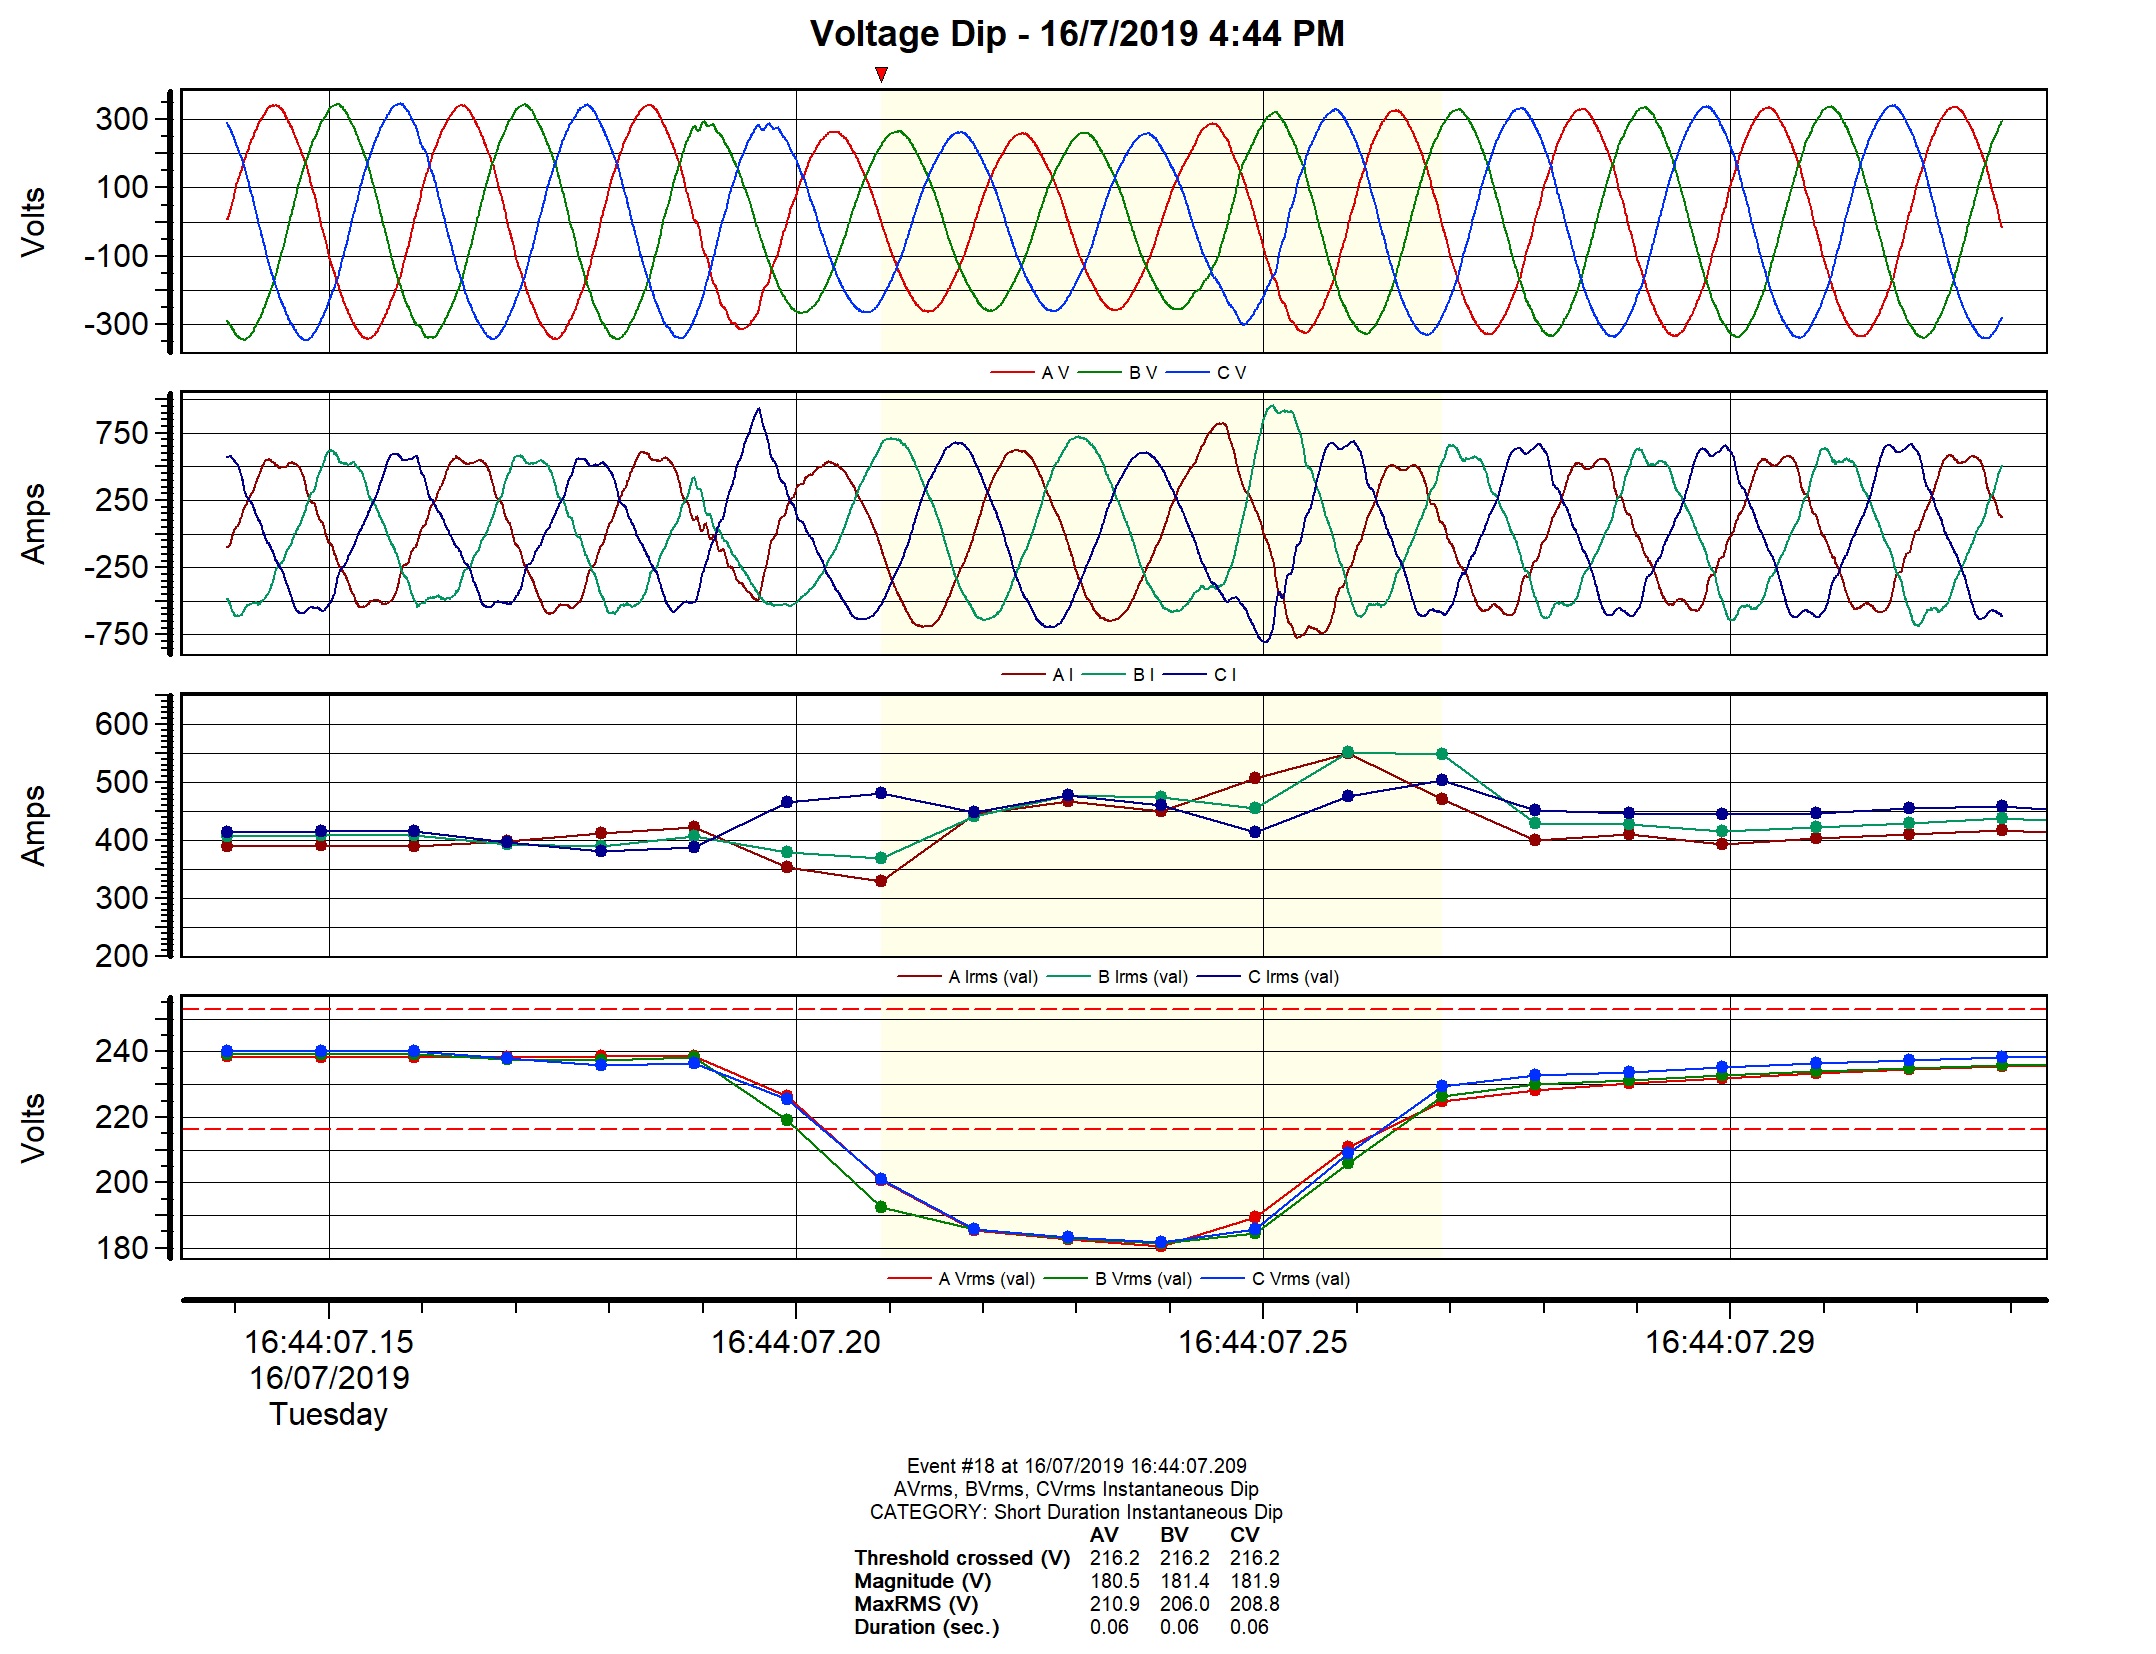
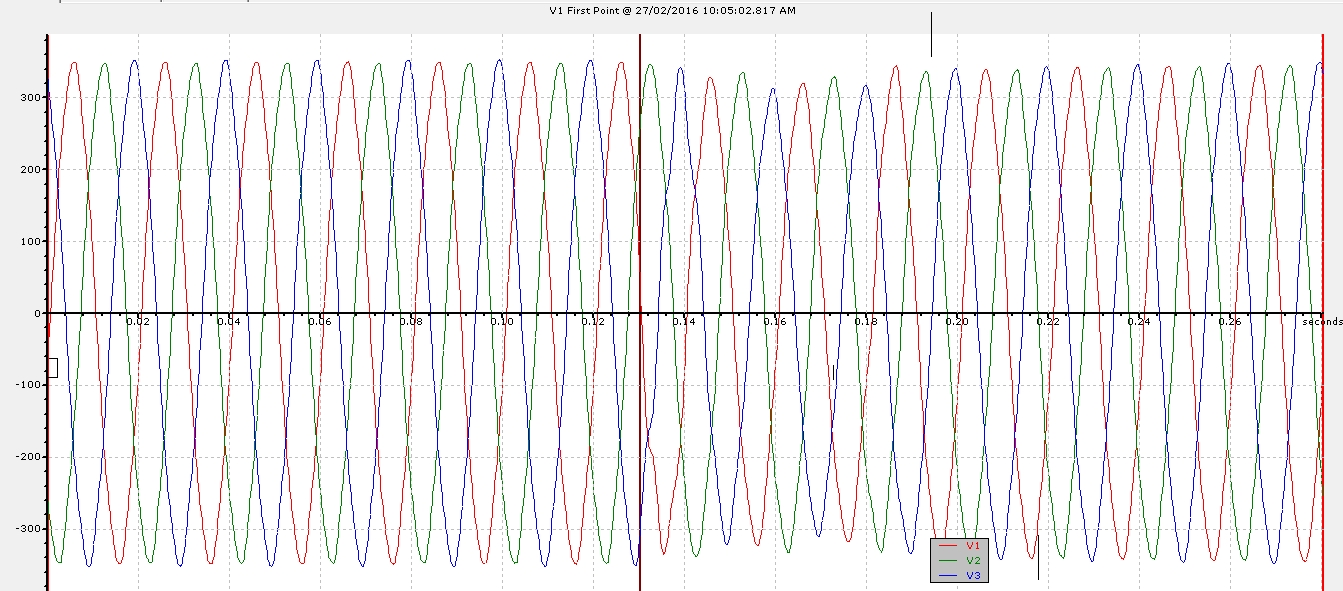
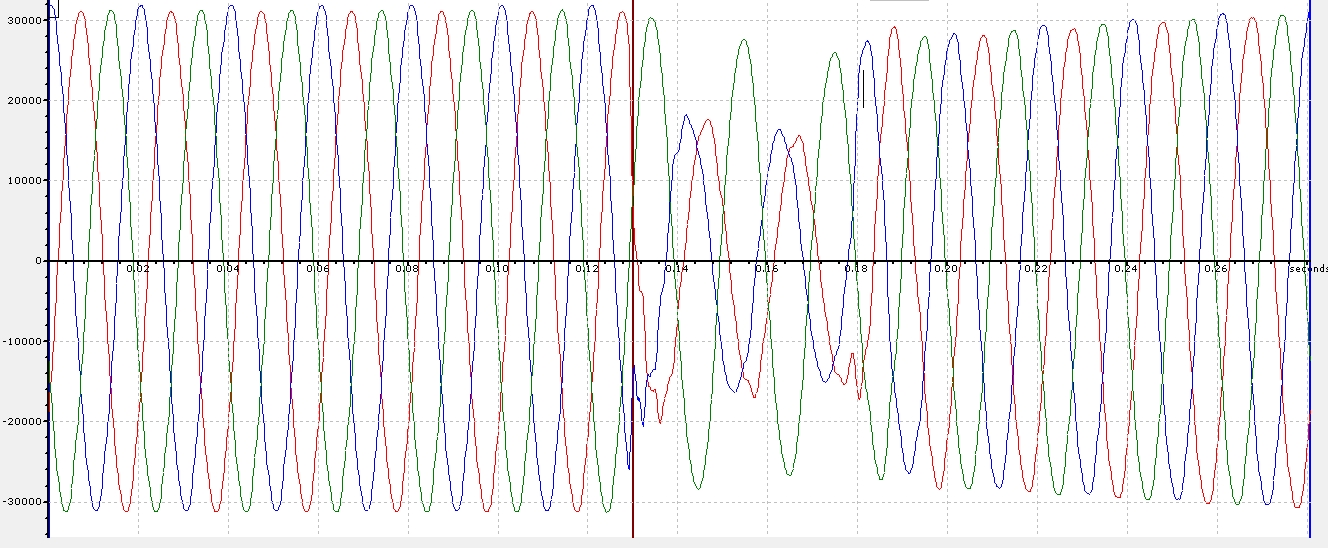
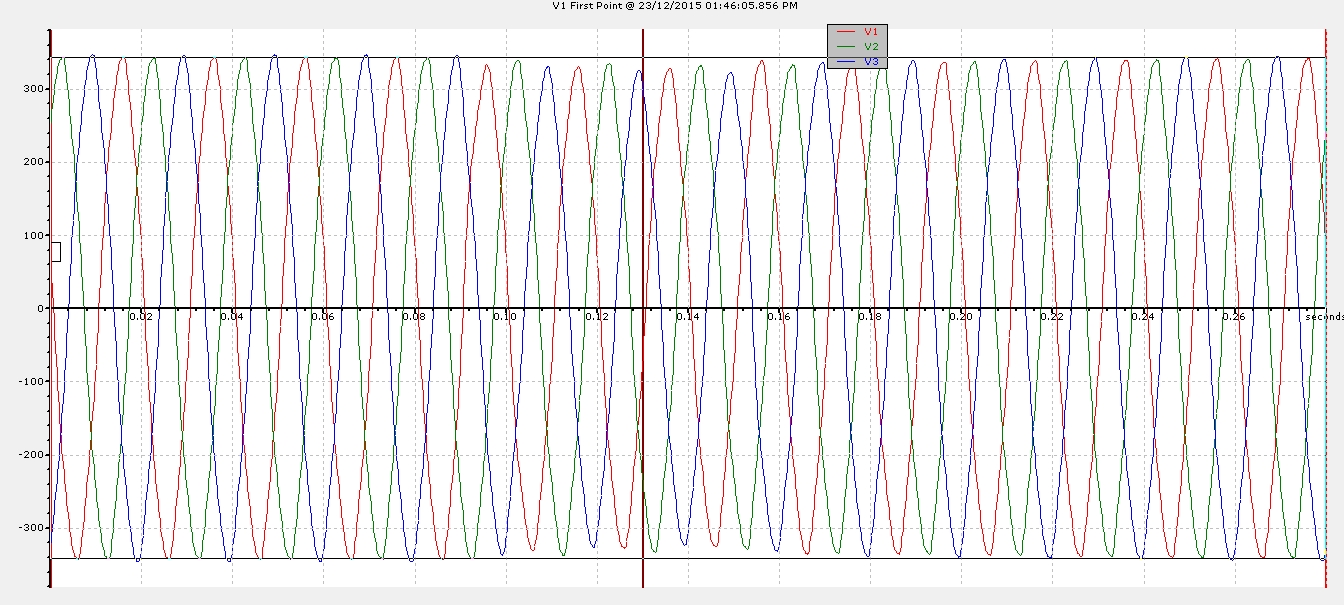
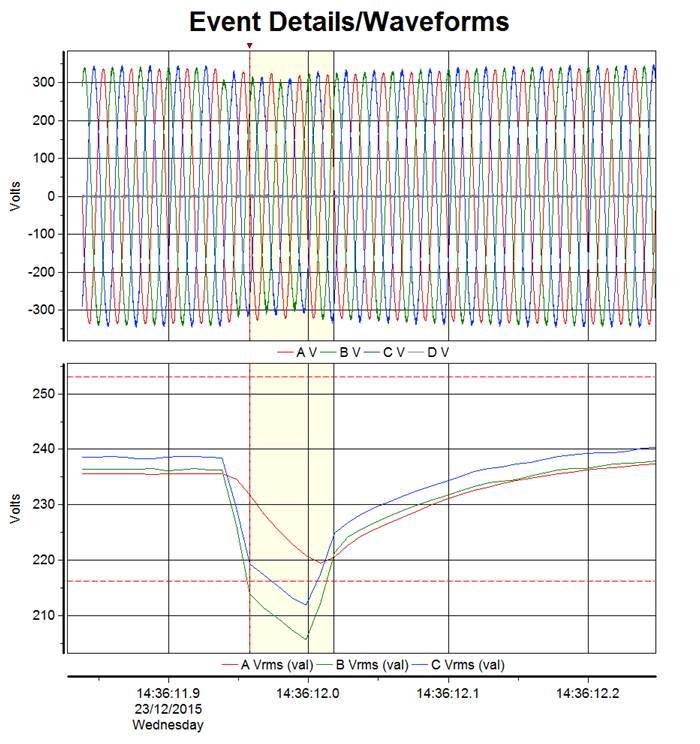
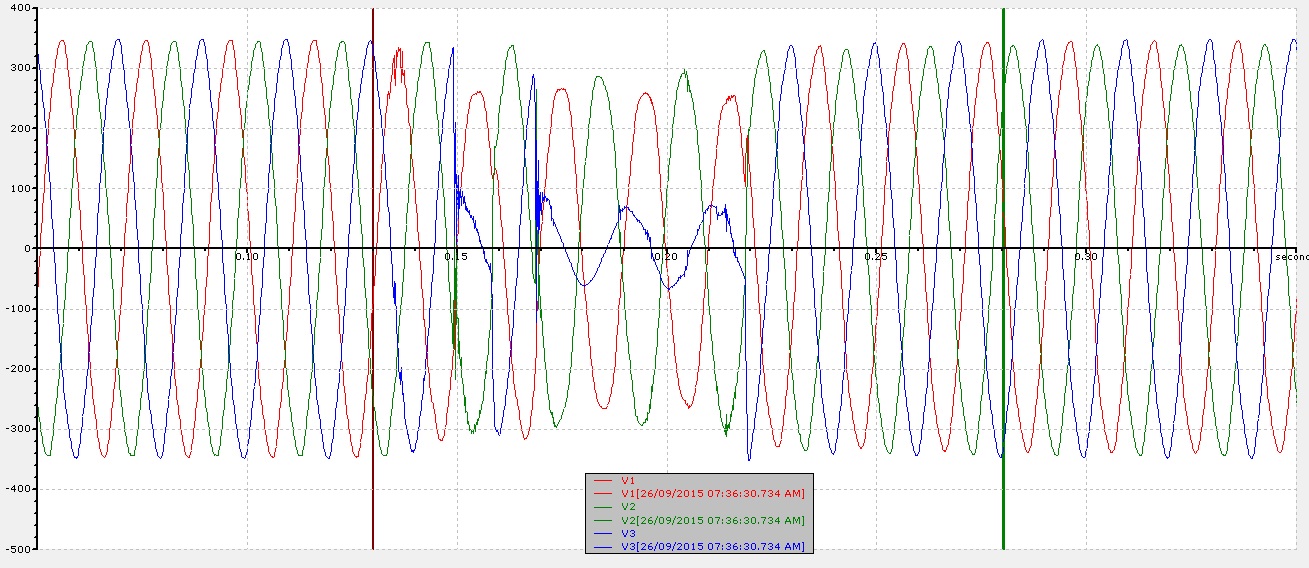
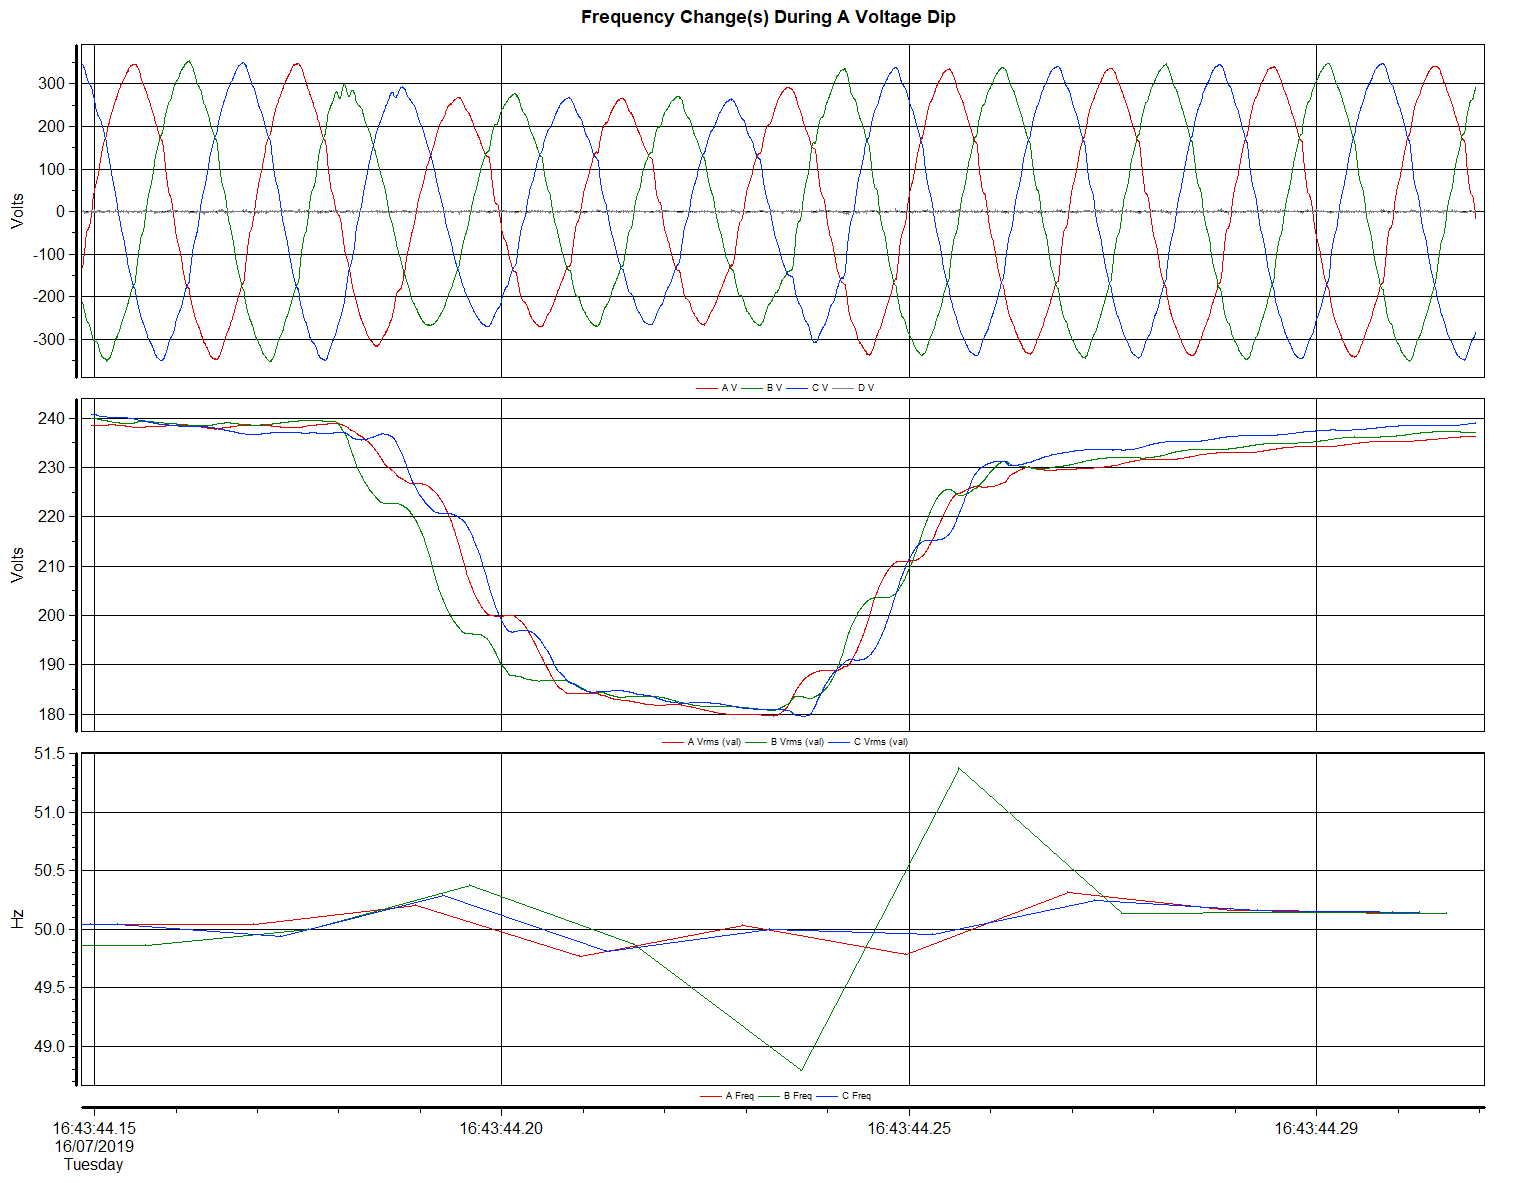
With the voltage waveforms captured, it is technically possible to calculate the frequency values during a particular event (say a voltage dip). Here’s an example, where the event waveforms were post-processed (via the Dranetz Dranview 7 software).

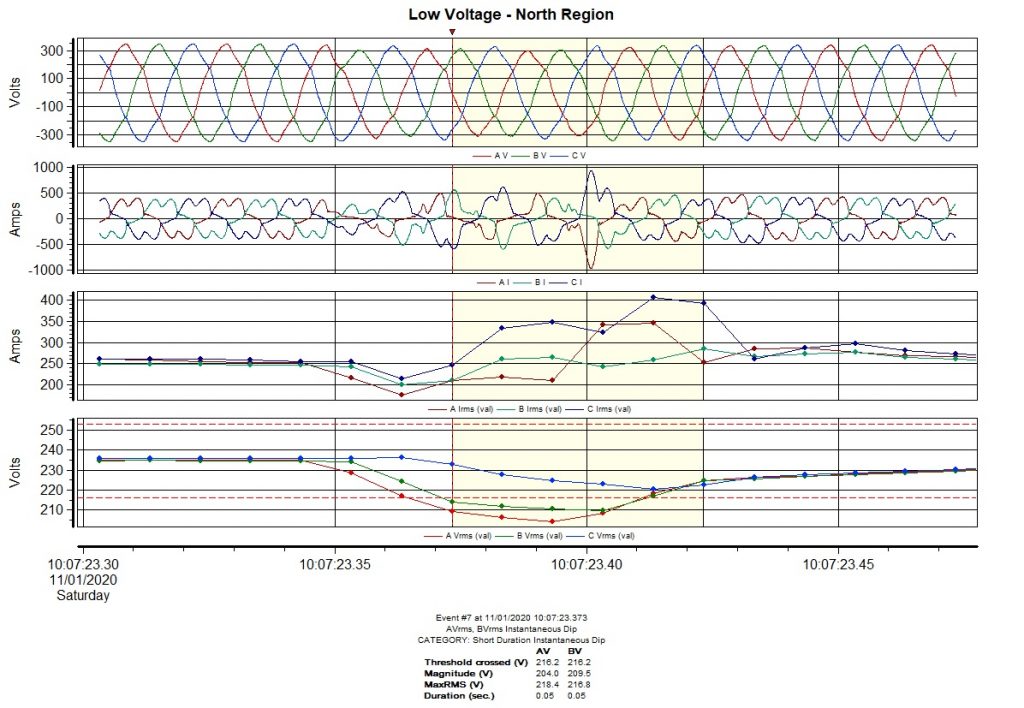
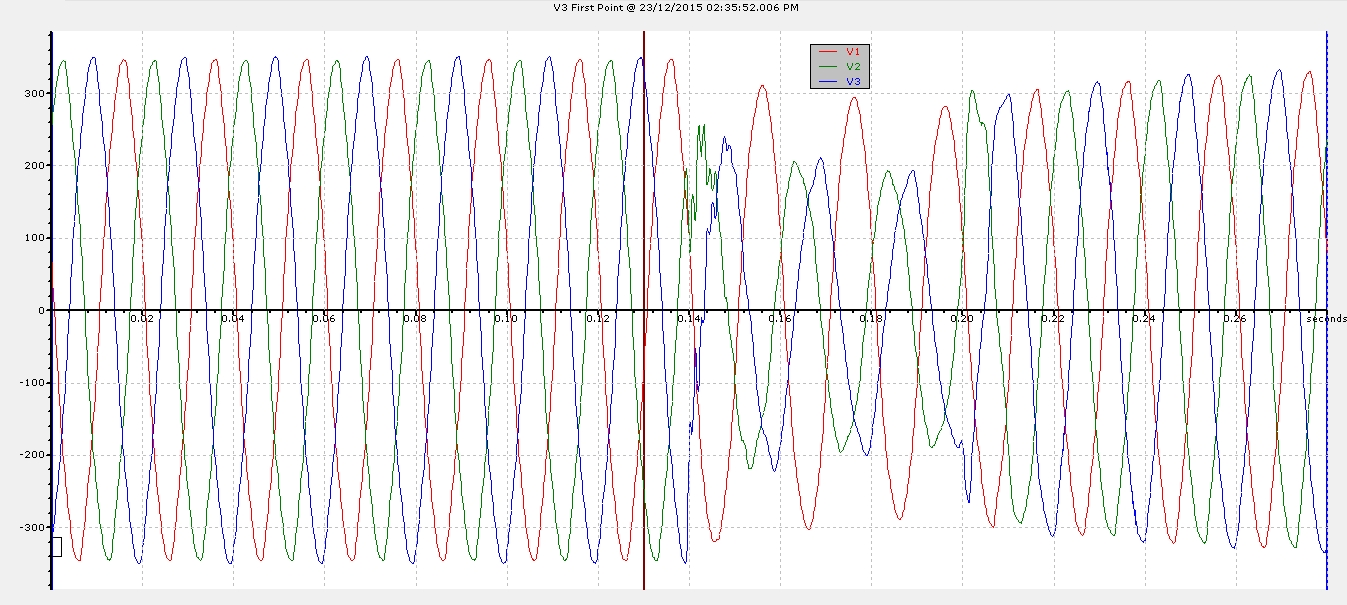
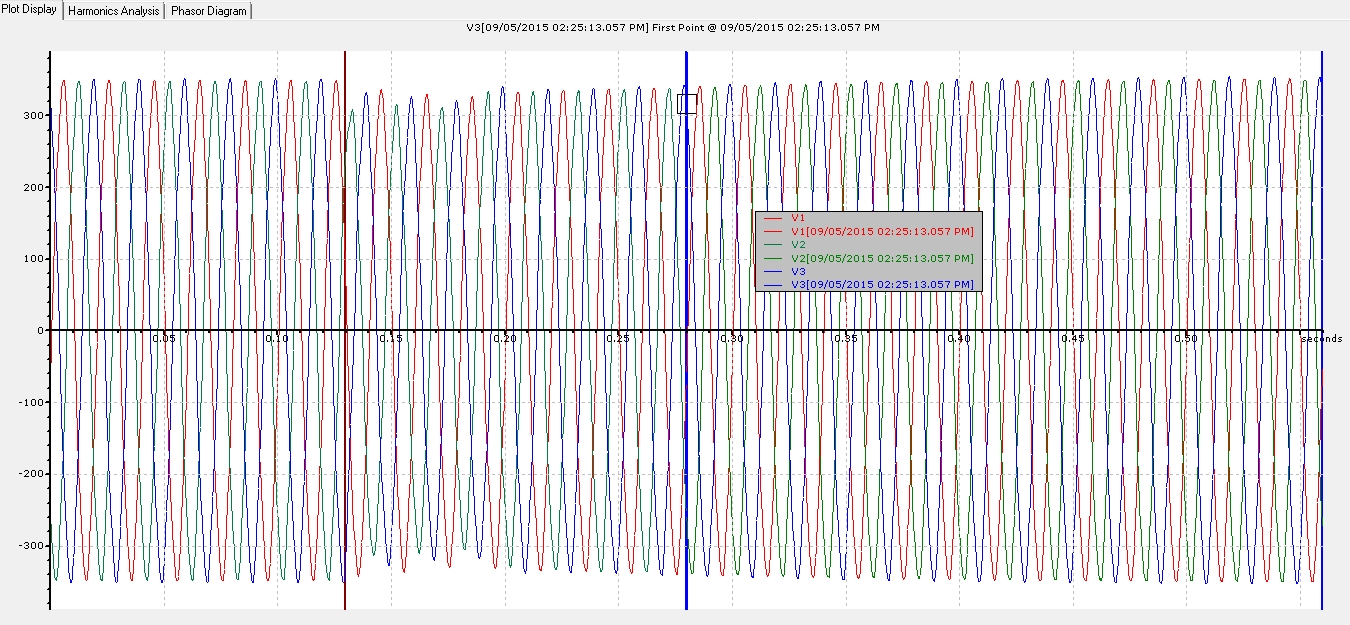
Such post-processing feature is very useful especially in generator load-test applications, where one will be interested to know both the voltage and frequency changes during every step-load change. An example is shown below. One just need to ensure that the pre/during/post event waveforms were set to be captured properly (i.e enough cycles). The software will do the rest.

Voltage Dip 13/09/2020 1857hrs

Earlier this evening, there was a voltage dip that occurred just before 7pm. The following is a waveform captured at Low Voltage (monitored at L-N), located in the city area.

Reports of voltage dips from other PQ monitors in other transmission blocks suggest this was a Transmission-level fault.

Voltage Dip 13/09/2020 1857hrs (LV L-N)

Voltage waveform seen here was at LV (L-N). It mirrored what was seen at 22kV and above (at L-L). From here, it can be inferred that there was a transmission level single phase fault (Phase L1).

Voltage Dip 07/03/2020 1900hrs

Earlier this evening, there was a Transmission-level fault that occurred at approximately 7pm. The following is a waveform captured at 22kV incomer (monitored at L-N), located in the city area.

Here, it suggests that there was a Single-phase fault (L2) and that it originated upstream at higher voltage levels. There were reports of voltage dips from other PQ monitors in other transmission blocks as well.

Update: Suspected fault originated from Genco facilities in the west.

Voltage Dip 7/3/2020 1900hrs
22kV L-L RMS Trend

Voltage Dip 11/01/2020 1007hrs

Earlier this morning, there was a Transmission-level fault that occurred at approximately 10:07AM. PQ monitors in the city-area captured the following waveforms at the 22kV incomer and at the 400V LT incomer side.

Here, the benefit of monitoring at L-N instead of L-L at 22kV is being showed clearly here. It is evident that there was a single-phase fault (L2) and that it originated upstream at higher voltage levels.

Note. A single-phase fault at 22kV will cause the other two phases to swell (not seen here).

There were reports of voltage dips in other transmission blocks from other PQ monitors. With this kind of magnitude observed here at 22kV, it is very likely that this fault originated in the same transmission block as well.

Update: 230kV cable damage along Keppel Road (South Region).

22kV Incomer – Monitored at L-N (South region)
LT Incomer – Monitored at L-N (South region)

When a 230kV fault occurs, a quarter of Singapore will feel the worst dip magnitude (the region where the fault occurs), with the other 3 regions observing shallow voltage dips. Below is an example (via a Dranetz HDPQ) in the North region of Singapore during this same incident.

LT Incomer – Monitored at L-N (North Region)

Voltage Dip 16 July 2019 4:44 PM

Earlier in the week, areas in Tampines, Loyang, Bedok, Pasir Ris will have experienced voltage dips. It was made known later that it was due to a 22kV cable fault in Tampines area.

Few sets of our portable PQ analyzers placed in Loyang was able to capture this event. It registered voltage dips (at low voltage) of about 20%, lasting around 60-80ms. Recorded data showed that it was a three-phase fault.

One may be curious, how could a fault in Tampines result in a voltage dip in places like in Loyang or Bedok?

Our local distribution grid is densely interconnected, resulting in a high-reliability electricity network. Total blackouts are rare. But interconnectivity brings about a small disadvantage. Any fault will be seen/felt (in the form of a voltage dip) by everyone who is connected. The seriousness of this dip will be dependent on the types of faults and the electrical distance between you and the fault point.

Here in our case, the fault was in Tampines area. Based on experience, for a voltage dip ~ 20% to be seen at another 22kV network, it will need to be a significant fault causing a voltage dip in the range of 80-90% in the fault area (Tampines). Loyang (where our PQ analyzers were) is connected to Tampines at 66kV level.


Voltage Dip 27-02-2016 1005hrs

Just a while ago, the following waveforms were captured from monitors in Jurong East and in the River Valley area, indicating a transmission fault, likely to be originating from the South block of Singapore. Waveforms captured in the River Valley area indicated a single-phase fault on L1 (Red) at 230kV transmission voltage.

Captured at LV (West area)

Captured at 22kV (South)
Captured at 22kV (South area)

Added the following screenshots obtained from a PQUBE, being monitored in South of Singapore, at Low Voltage. Thanks James!

PQUBE Waveforms - EcoXplore
PQUBE Waveforms – EcoXplore

PQUBE RMS Plot - EcoXplore
PQUBE RMS Plot – EcoXplore

“Back to back” Voltage Dips

Earlier this afternoon in the midst of the year-end festive mood, you might have seen your office lights flickered twice in an hour: two transmission-level faults occurred. Tell-tale signs were from the nature of the waveforms and that in general, everyone in Singapore ‘felt’ it, with 1/4 of the island getting the ‘worst-magnitudes’.

One at around 1:46pm and the other at 2:36 PM. The following were captured from an office in Jurong East and in Bedok area (at low voltage).

At 1:46PM, it can be seen that the dips were fairly shallow.  Hence it can be deduced that the origin of the fault were neither in the 230kV blocks that these two sites are located. From the RMS trend of the waveforms captured at Site 2, it can be inferred that it was likely a single-phase 230kV fault on Phase L1 (Red).

Site1 Jurong East 1346hrs
Fig1: Site1 Jurong East 1346hrs

Site2: Bedok 1346hrs
Fig2: Site2 Bedok 1346hrs

At 2:36PM, the dips were much more pronounced at Site 1, suggesting that it resides in the same 230kV block as the fault. Here it is very clear that the 230kV fault was on the Phase L3 (Blue). At the second site at Bedok, the dips were again shallow. These are characteristics of a 230kV transmission level fault in Singapore. Only 1/4 of the island will be most affected with dip magnitudes in the range of 40 to 50% (dip by).

Fig3: Site1 1436hrs
Fig3: Site1 1436hrs

Fig4: Site 2 1436hrs


Localized Voltage Dip 26-09-2015 0736hrs

Earlier in the morning today, there was a localized voltage dip (dip by ~ 80%) in the Jurong East area. From the waveforms captured, it can be inferred that there was a 22kV L3-L1 fault.
Sensitive equipment was likely to be affected, especially those sensitive single phase LV control circuits taking in on Phase L3.

Localized Dip - Monitored at LV
Localized Dip – Monitored at LV

Islandwide voltage dip 9/5/2015 2:25PM

Earlier at 2:25PM, there were voltage dips reported all over the island.
This is the waveform captured at low voltage in Jurong East, typical of a 230kV transmission level fault.
This small dip in voltage here suggests that the transmission fault did not originate from this particular 230kV block, where this PQ monitoring device is located.

voltage dip 09-05-2015 225pm